Serverless monitoring for AWS Lambda offers in-depth performance monitoring for your Lambda functions. This document explains how to:
- Find your Lambda data in the UI
- Understand the UI components
- Understand your chart data
- How to create custom charts
View your data
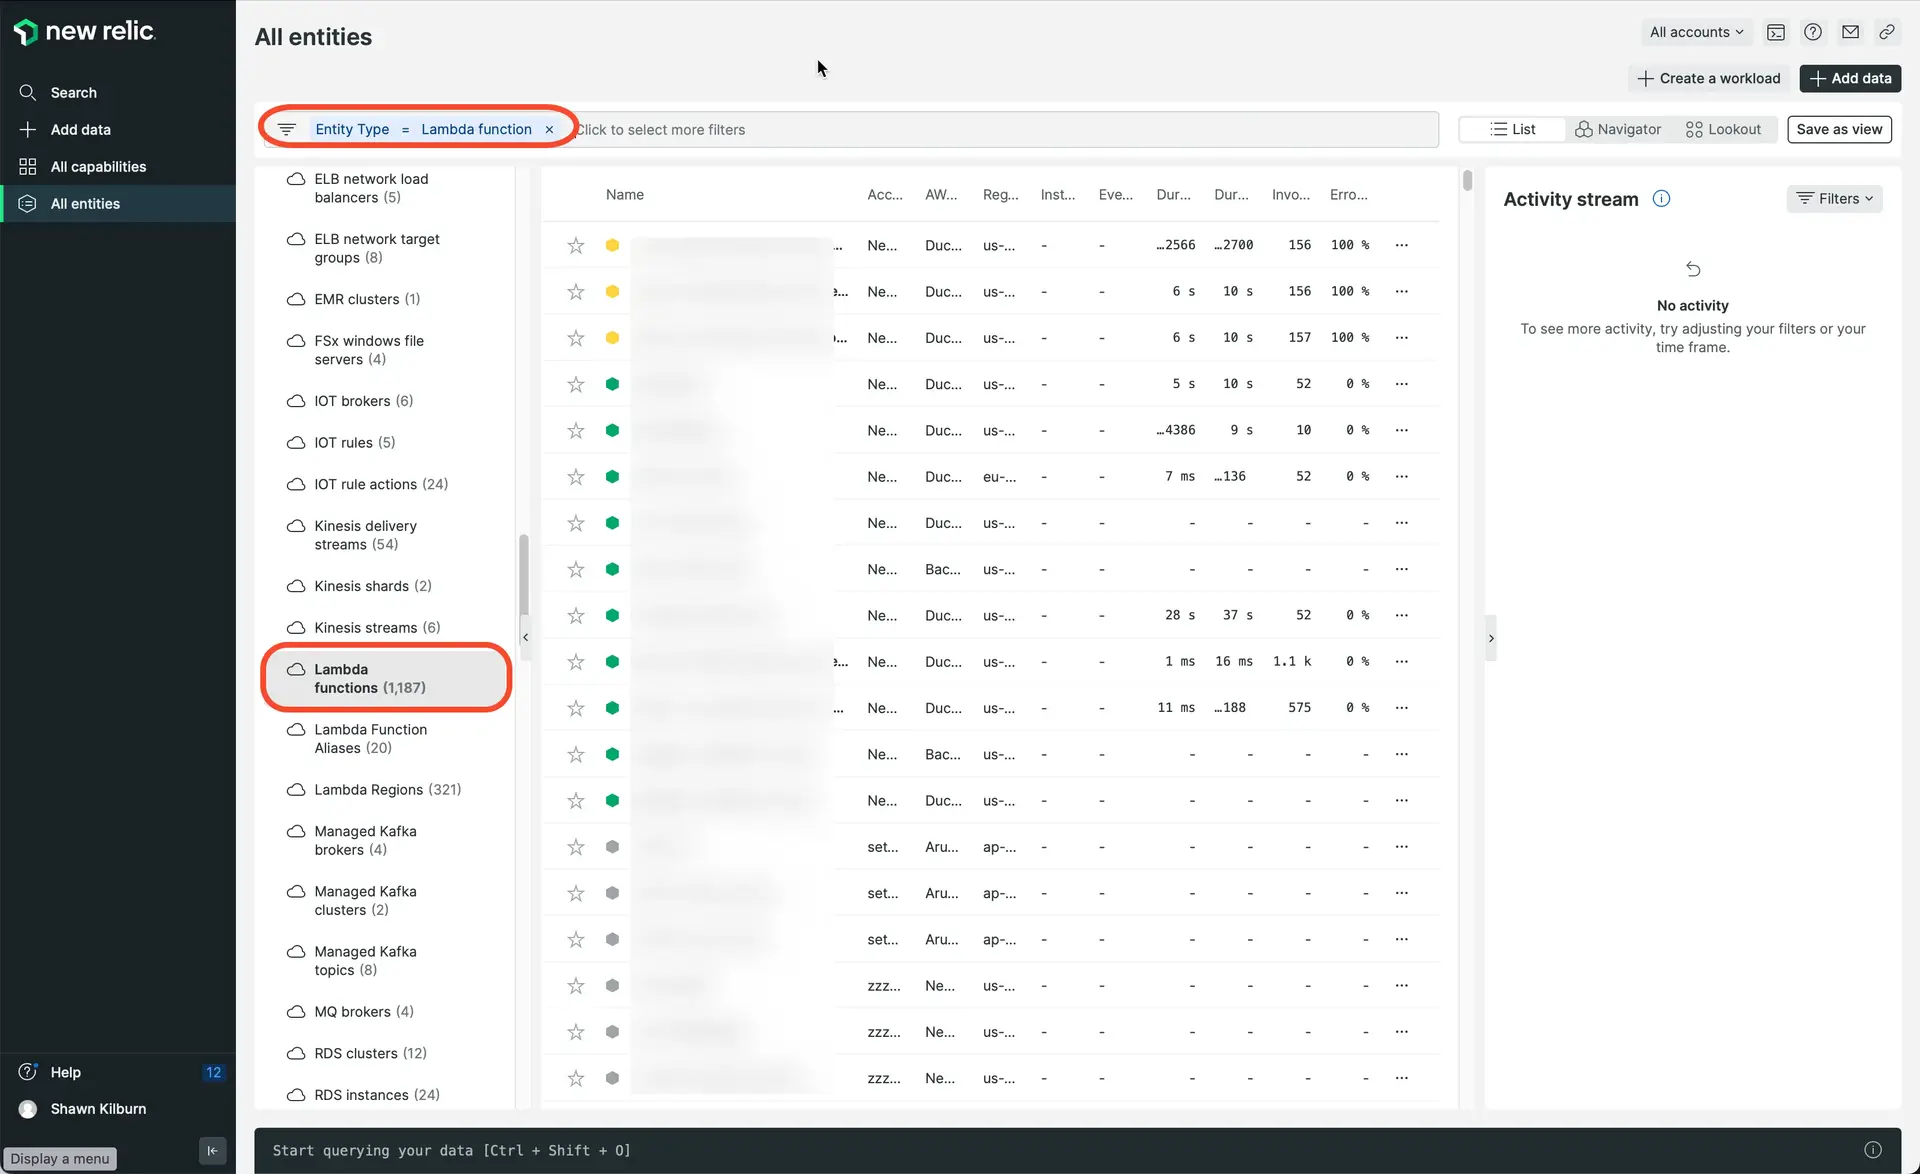
one.newrelic.com > All capabilities > All entities > Amazon Web Services > Lambda functions: Click Lambda functions to see charts and details.
To view your Lambda data in New Relic: Go to one.newrelic.com, click Explorer. In the left nav under Amazon Web Services, click Lambda functions.
For more about our UI, see Intro to the New Relic platform.
중요
If you can't find your Lambda data:
- Ensure you've followed the instructions for enabling Lambda monitoring.
- Note that this feature is different from our infrastructure monitoring Lambda integration.
UI pages
Here are descriptions of the UI pages available for our Lambda monitoring:
UI page | Functionality |
|---|---|
Summary | The Summary page displays charts that give you a quick view into the most important performance data. If available, this will feature data gathered from APM agent instrumentation. Lambda functions instrumented via OpenTelemetry (ADOT layer) now display the same Summary page experience as APM-instrumented Lambda functions, with metrics normalized to the |
CloudWatch metrics | The CloudWatch metrics tab displays Lambda performance data sourced from AWS CloudWatch via New Relic's metric synthesis layer. Charts include: invocation counts, duration, throttles, and error counts. This tab is available for both APM-instrumented and OpenTelemetry (ADOT)-instrumented Lambda functions. |
Transactions | The Transactions tab lists Lambda transactions along with performance data such as duration and throughput. The AWS Request ID column identifies each Lambda execution by its unique AWS request identifier, allowing you to drill down into a specific invocation's APM transaction trace. |
Distributed tracing | The Distributed tracing page shows distributed traces that include the monitored Lambda function. For details about this feature, see Distributed tracing. |
Errors | The Errors page displays errors ( |
Logs | The Logs page displays recent log messages from your Lambda function. For details about this feature, see Logs. |
Understand chart data
Lambda data charts are generated by running NRQL queries of Lambda-related event data. You might view a chart's NRQL query to:
- To better understand what a chart is displaying
- To get ideas on how to create a custom NRQL query and chart
Related documentation: