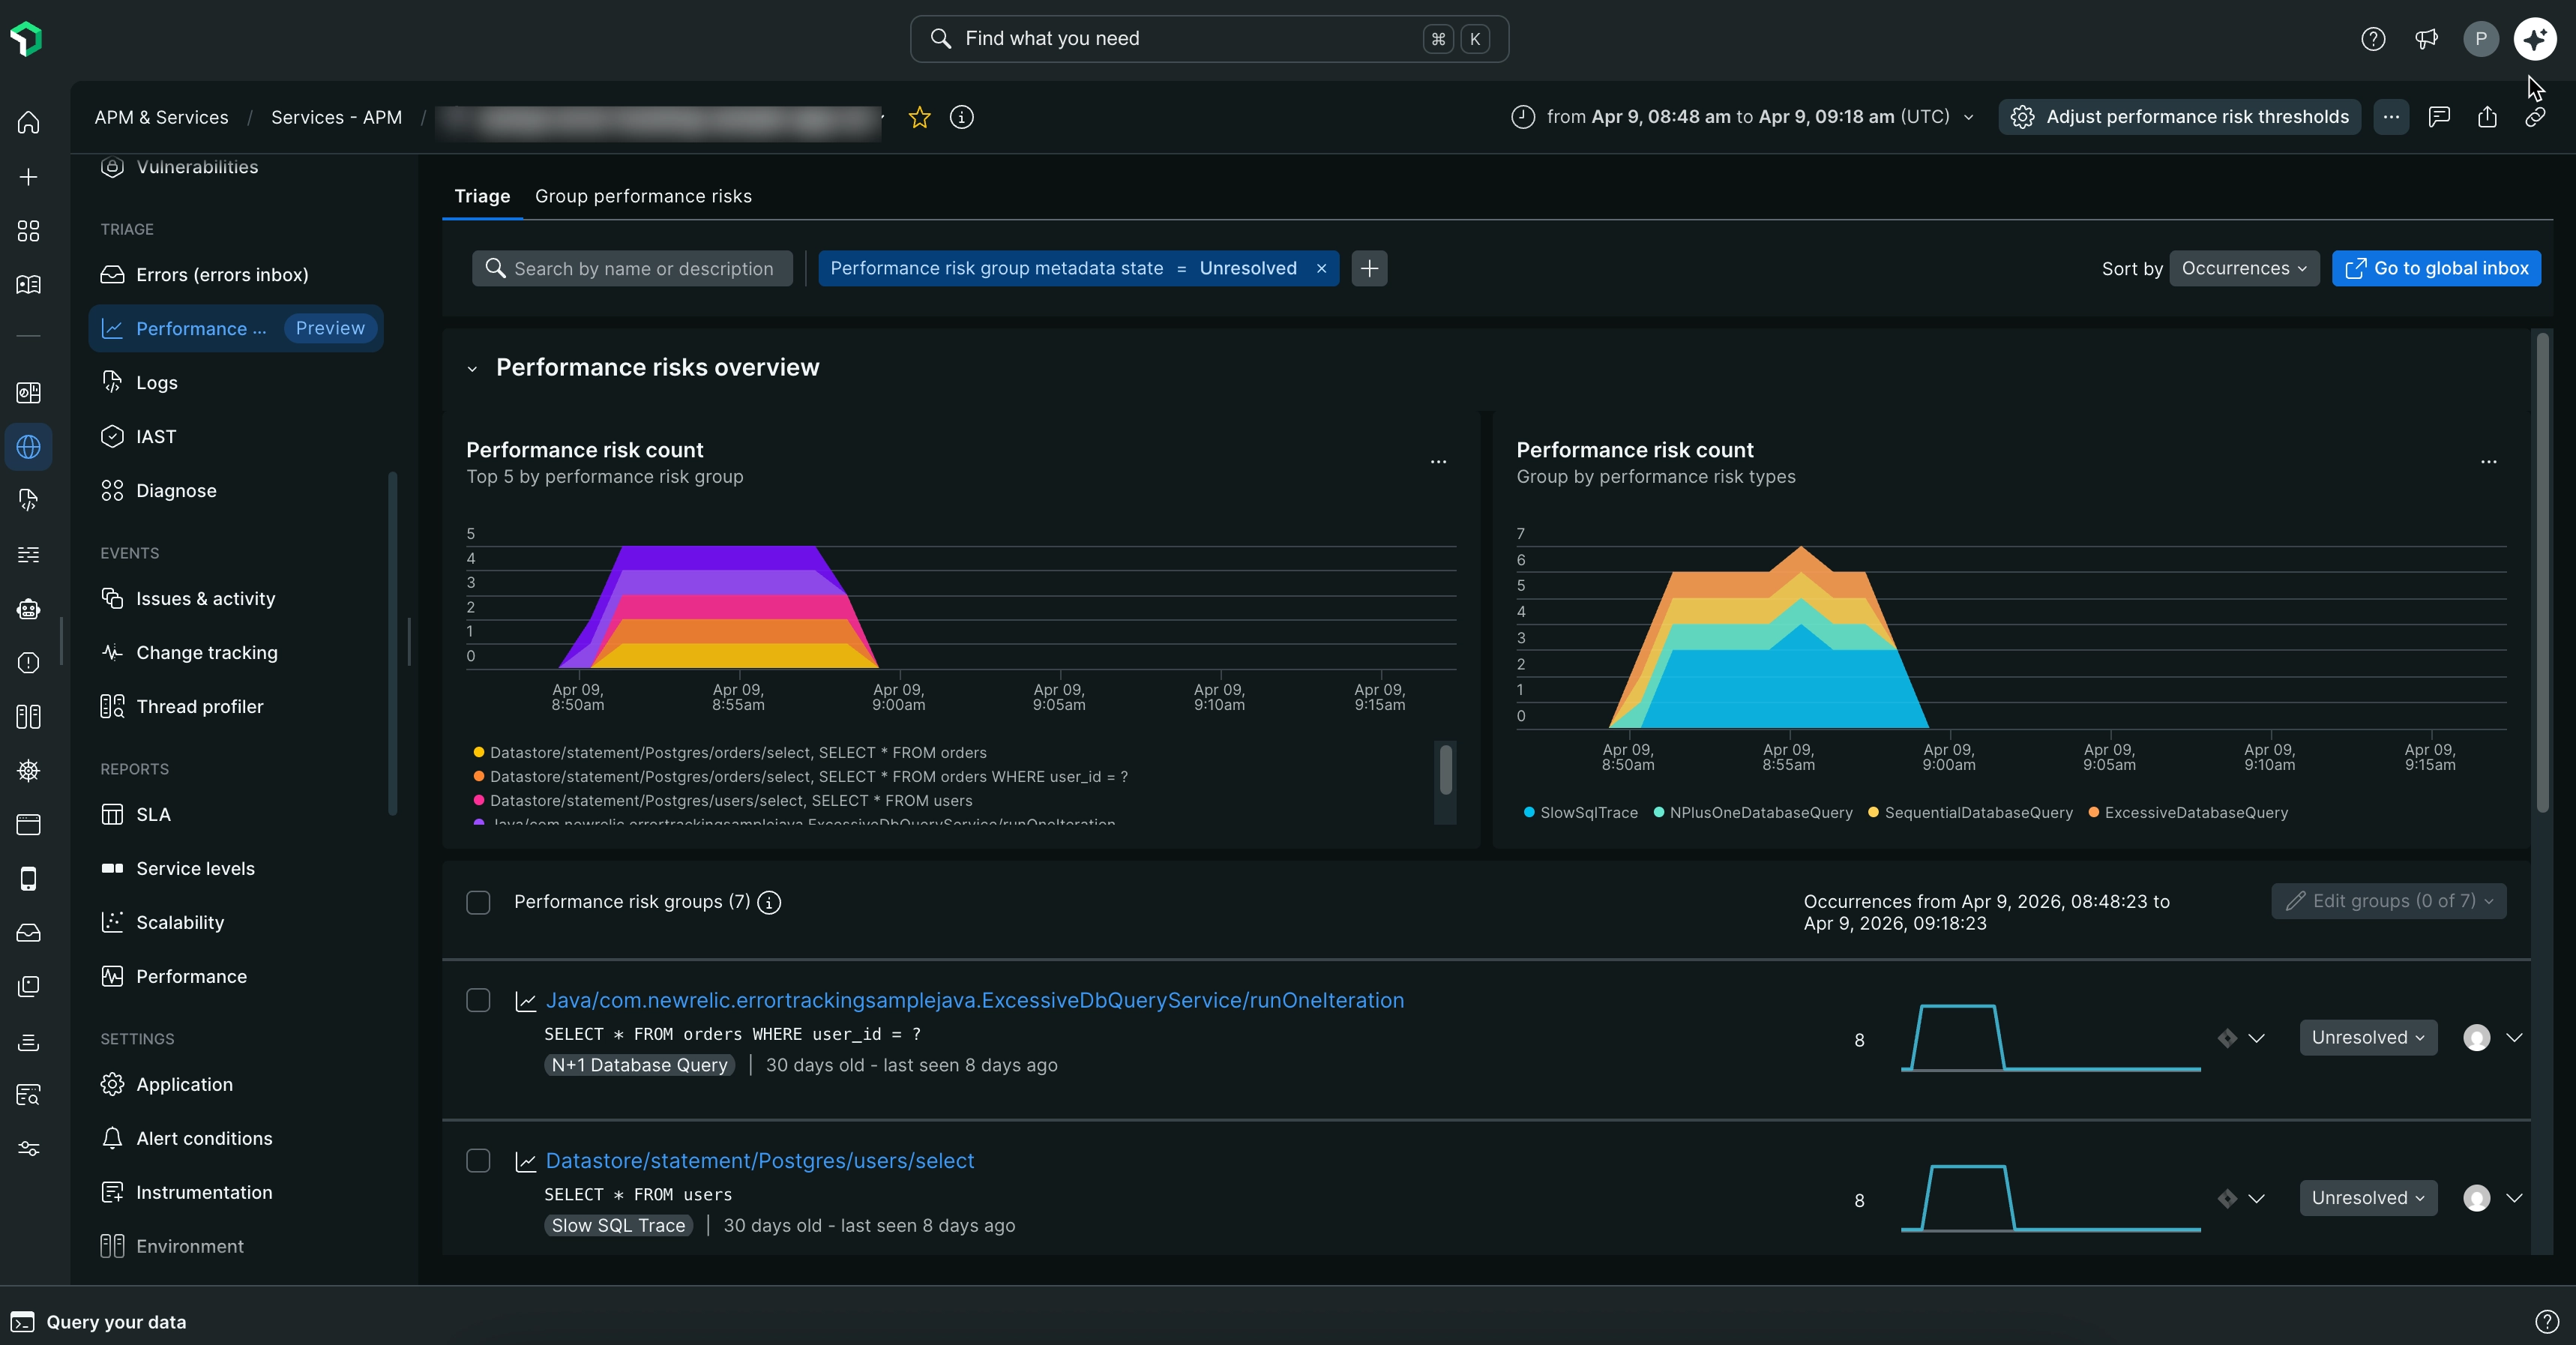
Performance Risks inbox adds an intelligent layer on top of New Relic's telemetry data, continuously scanning your applications for performance issues and surfacing them before they escalate into production incidents. It uses built-in analyzers to automatically detect performance anomalies using configurable thresholds, and groups similar issues together so you can focus on resolving the most impactful problems first.
Coverage and scope
Performance Risks inbox provides comprehensive monitoring across your entire application stack:
APM services
Browser applications
Workloads
Key benefits
Proactive issue detection: Identify performance problems before they escalate into production incidents
Reduced Mean Time to Resolution (MTTR): Intelligent grouping helps you focus on the most critical issues first
Improved engineering productivity: Spend less time on manual performance investigation and more time on innovation
Better application reliability: Address performance risks before they impact your end users
How does Performance Risks inbox work?
Performance Risks inbox uses the following analyzers to detect the most common performance issues:
APM analyzers
Slow database queries are often the root cause of application performance issues and can lead to cascading problems across your entire stack. The analyzer identifies database queries that are taking longer than expected to execute, which can significantly impact application response times and user experience.
What it can help to detect:
SQL queries exceeding performance thresholds
Database operations that may be causing application bottlenecks
Queries with degrading performance over time
N+1 queries can exponentially increase database load and response times as your data grows, making this a critical performance issue to address early. This analyzer detects the common N+1 query anti-pattern where an application executes N queries instead of one query. This typically occurs in ORM frameworks when loading related data.
What it can help to detect:
Repeated database queries in loops
Inefficient data loading patterns
ORM-generated query sequences that could be optimized
Excessive database operations can overwhelm your database servers and create performance bottlenecks that affect your entire application. This analyzer monitors for applications that make an unusually high number of database connections or queries within a given timeframe, indicating potential inefficiencies in data access patterns.
What it can help to detect:
Abnormally high database query volumes
Inefficient batch processing patterns
Sequential database operations often represent missed optimization opportunities that can significantly improve application performance with relatively simple changes. This analyzer helps to identify situations where database operations are being performed sequentially when they could be optimized through parallelization or batching.
What it can help to detect:
Sequential database operations that could be parallelized
Missed opportunities for batch processing
Inefficient data access patterns
Browser analyzers
Large HTTP payloads can slow down network transfers, increase bandwidth costs, and negatively impact user experience, especially on mobile devices or slower network connections. This analyzer monitors HTTP requests and responses for payloads that exceed optimal size thresholds.
What it can help to detect:
HTTP requests or responses with large payloads
API endpoints returning excessive data
Inefficient data serialization or transfer patterns
Slow HTTP responses can degrade application responsiveness, reduce throughput, and frustrate users waiting on data; particularly in latency-sensitive workflows or regions with higher network overhead. This analyzer monitors HTTP transactions for response times that exceed optimal latency thresholds, which can signal deeper performance issues across your stack.
What it can help to detect:
HTTP responses with high latency
API endpoints with consistently slow response times
Inefficient backend processing, query patterns, or third-party dependencies contributing to slowdowns
Use cases
Performance Risks inbox helps you address two key areas: reducing infrastructure costs and improving application performance. The following are sample use cases illustrating how Performance Risks inbox can address these areas.
Reduce infrastructure costs
Inefficient code patterns result in unnecessary resource consumption that directly impacts infrastructure costs:
N+1 queries: Instead of executing a single optimized query, an application executes one query to retrieve a list and then a separate query for each item in that list. At scale, a user waiting for 100 database queries to complete — when a single query could return the same result — increases both database load and resource usage unnecessarily.
Large HTTP payloads: When an application calls a large API and sends the full response on every user interaction, cloud providers charge for the bandwidth and data transfer of each call, even when that data was not required for the interaction.
Improve application performance
Performance issues directly affect application speed and responsiveness:
Sequential database queries: When a user requests two unrelated pieces of data, the application may fetch the first and wait for it to complete before fetching the second — even though both queries are independent and could run at the same time. The user waits longer than necessary for a result that could have been returned much faster.
Slow HTTP responses: When a user interacts with the application and sees a loading state for an extended period, it is often because an underlying API is not performant. The user is forced to wait for a slow response before the result appears.