New relic provides a budget of 15 million cardinality per account per day. Under each account you can have multiple metrics, each with a cardinality budget of 100,000. If cardinality usage of a metric approaches the limit, you can manage the cardinality in the following ways:
- Create pruning rules to remove non-critical attributes.
- Adjust the per-metric budget to allow more attributes for a specific metric.
重要
You can also increase the cardinality budget of your account up to 200 million depending on your data needs. This option is only available with the Advanced compute add-on as a part of the Compute pricing model. Advanced CCUs are consumed for the additional cardinality used beyond the default budget.
Create pruning rules
A common method to maintain account cardinality within its budget is to implement pruning rules for non-critical attributes, which removes unnecessary data. To create pruning rules:
Ensure you have the
Manage pruning rules: modifypermission. If you don't have this permission, reach out to your Authentication Domain Manager.Navigate to to one.newrelic.com > (click your user name) > Administration > Cardinality Management.
From the Metrics table, select the metric in which you want to create a pruning rule. The Cardinality Management page of the metric opens.
Go to the Attributes table and select the attributes you want to prune.

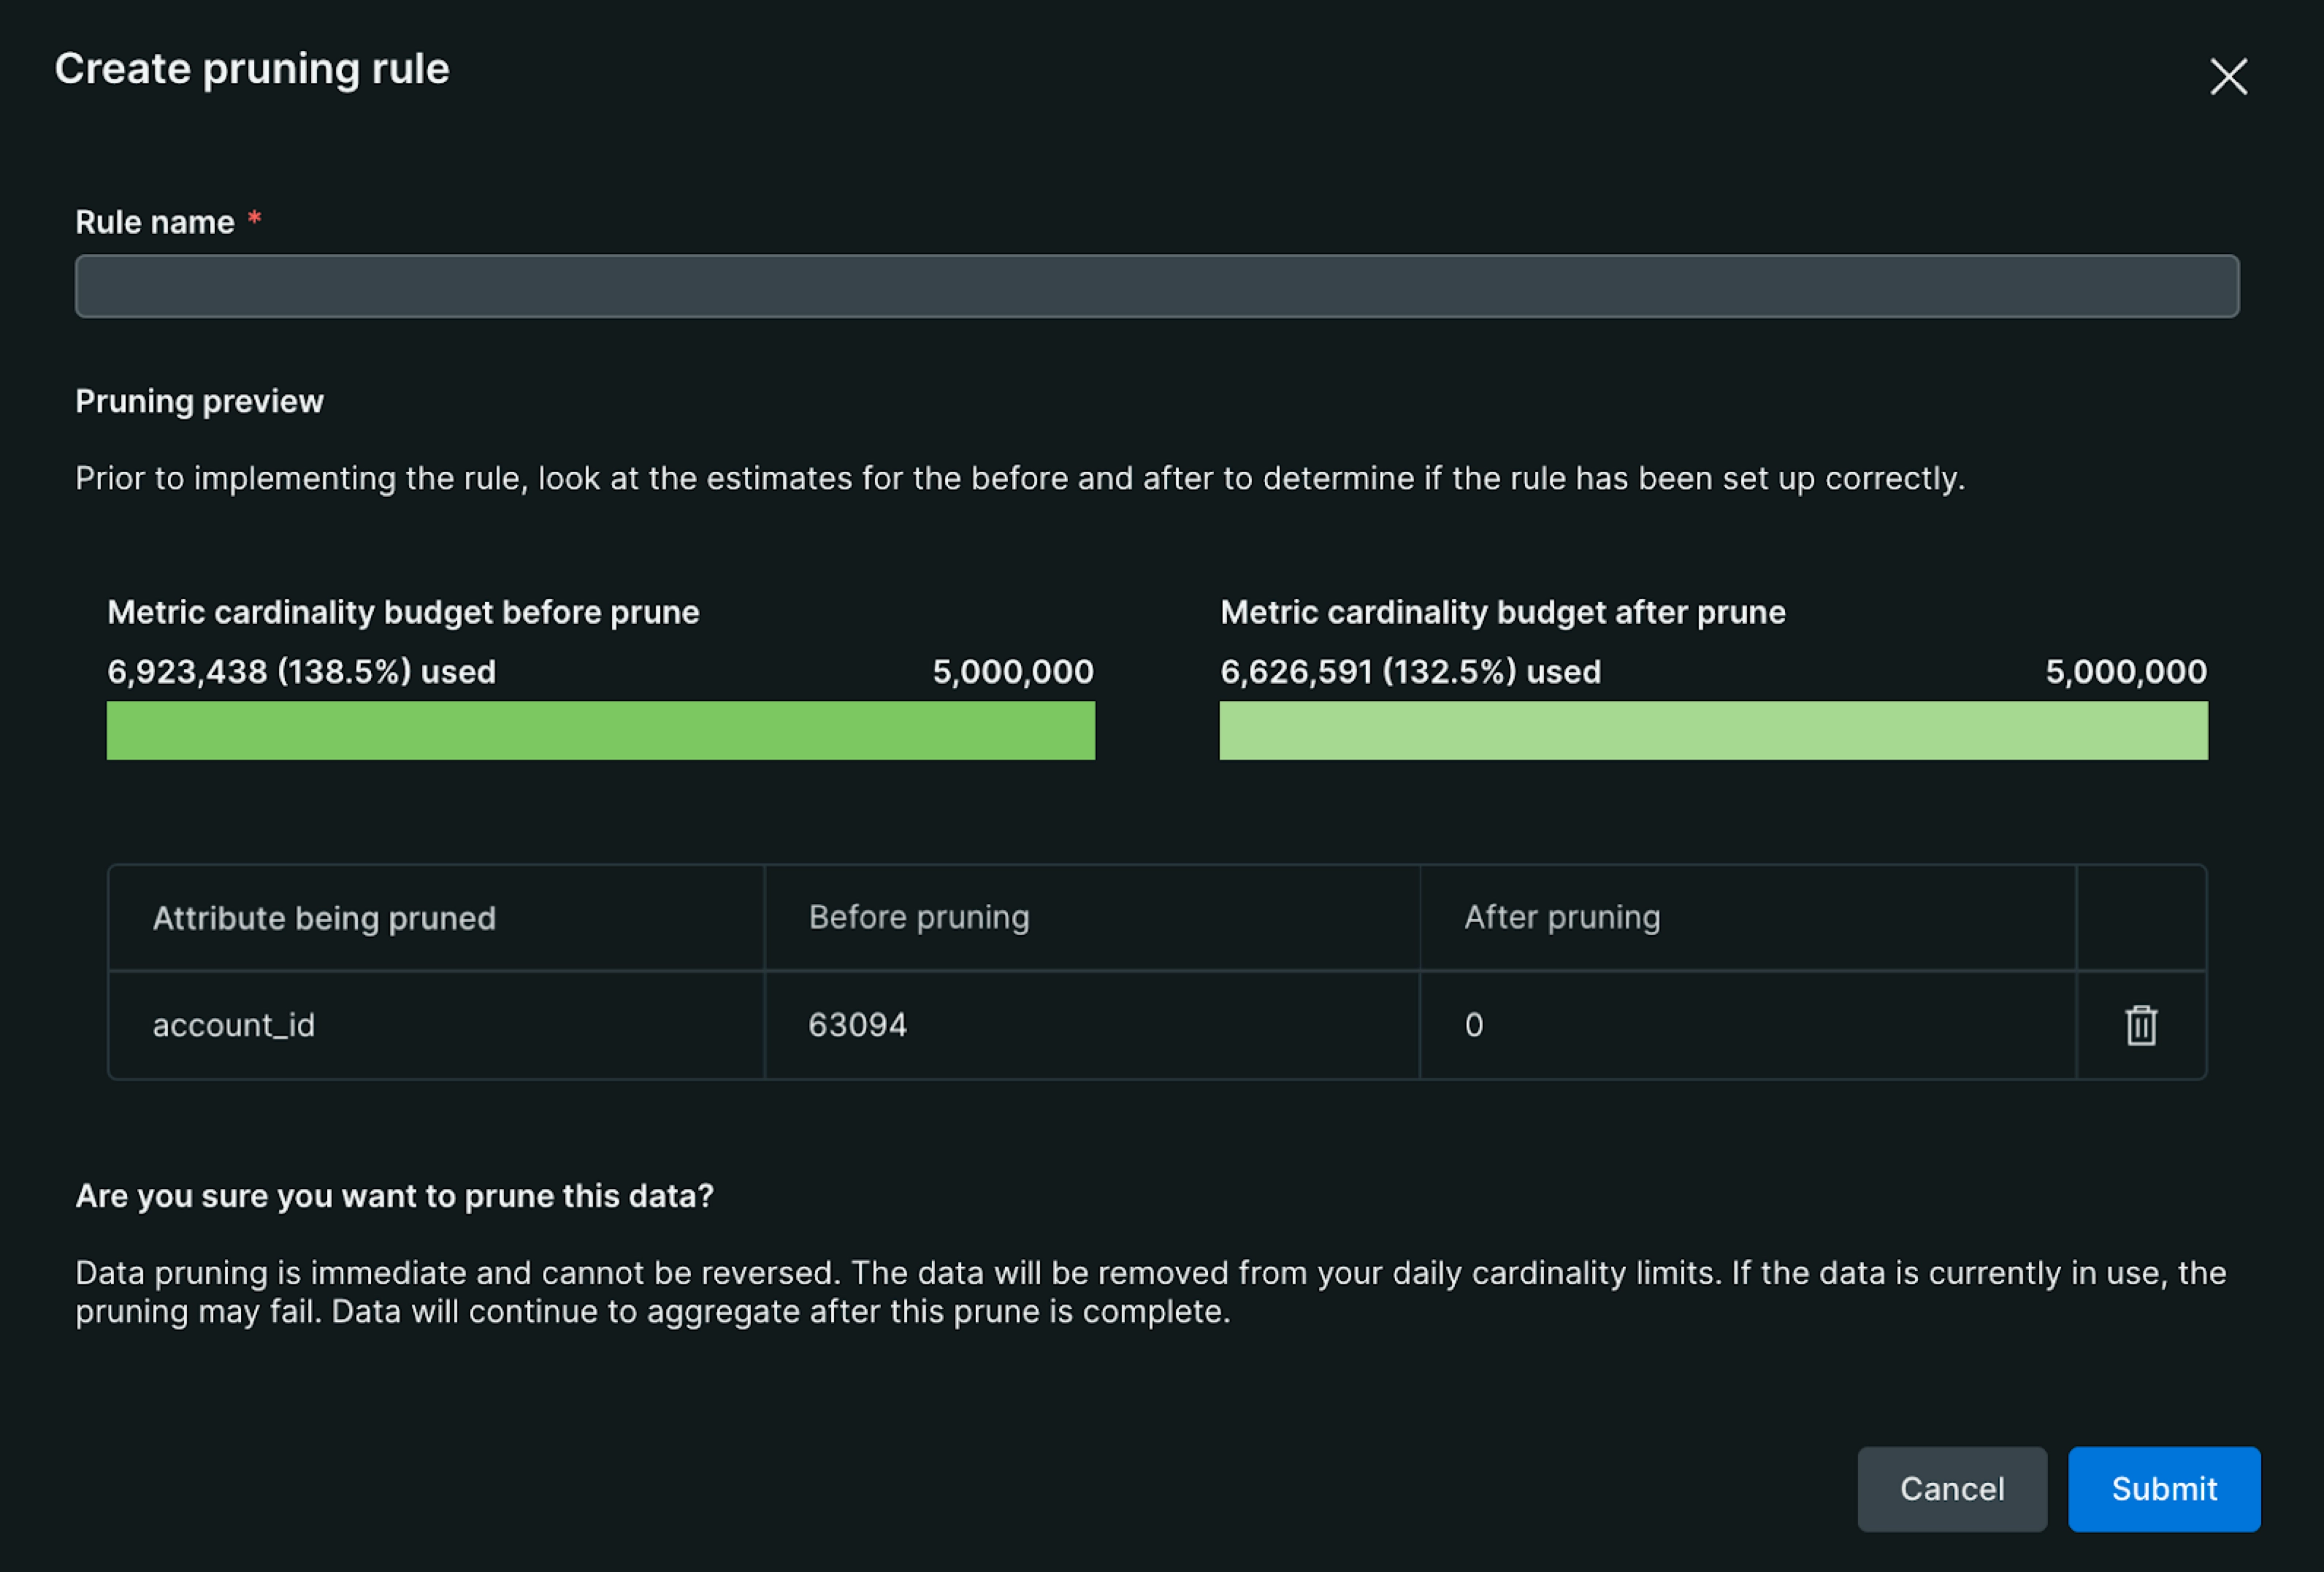
Click Create pruning rule. A pop-up appears, providing details on how the pruning rule impacts the metric's cardinality.

Enter a rule name or description.
Click Submit.
注意
Pruning rules take effect immediately. Ensure you want to prune the data before creating a rule. You can delete a pruning rule after creating it, but the rule may prune some data before you remove it.
Adjust per-metric budget
When all attributes of a specific metric are crucial and you approach your cardinality budget, you can adjust the per-metric budget to meet your needs. Typically, metrics have a default maximum cardinality of 100,000, but you can increase this up to 1 million per metric.
ヒント
Your account's overall cardinality budget remains unchanged. Therefore, setting all metric budgets to 1 million without careful consideration could quickly exhaust your account's cardinality capacity.
To adjust the per-metric budget:
- Ensure you have the
Manage metric cardinality: modifypermission. If you don't have this permission, reach out to your Authentication Domain Manager. - Navigate to to one.newrelic.com > (click your user name) > Administration > Cardinality Management.
- Select the metric for which you want to adjust the budget. The Cardinality Management page of the metric opens.
- Click Adjust metric budget.
- Update the budget to meet your needs. Make sure, it is less than or equal to 1 million.
Adjust additional account cardinality budget
While the default cardinality budget of 15 million is sufficient for most users, you may require a higher budget to accommodate your data needs. While you set an upper limit, you are only charged for the aggregates you generate above the 15 million default cardinality budget, up to the new limit you've set. Currently you can increase the cardinality budget of your account up to 200 million. If you need a higher budget, create a support ticket.
Prerequisites
To adjust the cardinality budget of your account, you must have:
Subscribed to the Advanced compute add-on.
Manage account cardinality: modifyandCustomer limits management: modifypermissions. Reach out to your Authentication Domain Manager to add these permissions to your custom role.Steps
To adjust the cardinality budget of your account, perform the following steps. The adjustment may take 15 to 20 minutes to take effect.
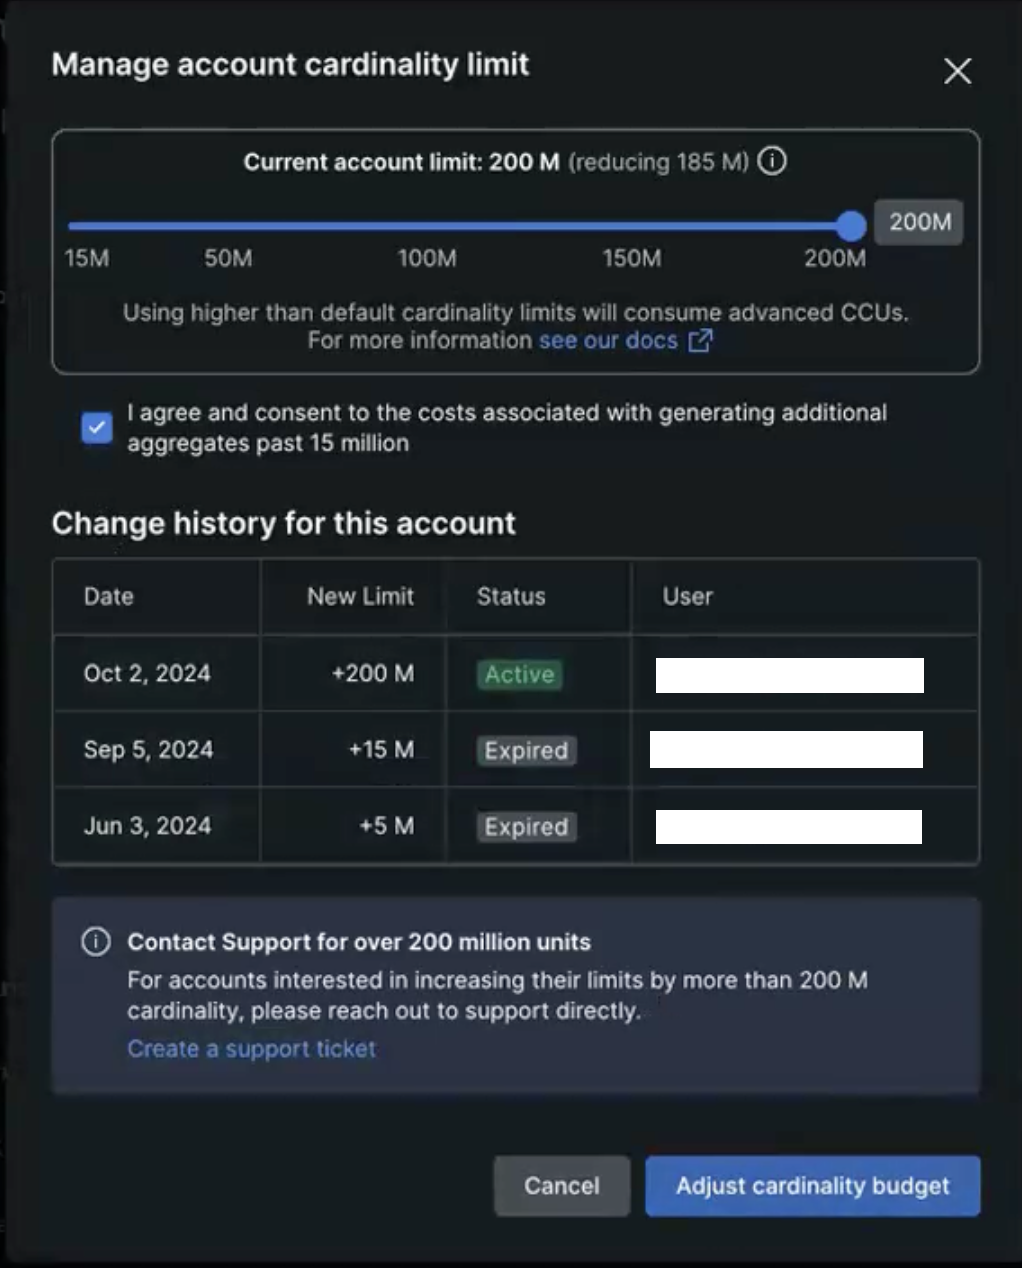
From the Cardinality Management page, click Manage account cardinality.
From the Manage account cardinality limit pop-up:
- Adjust the slider to set the new cardinality budget for your account. The maximum limit is 200 million.
- Tick the checkbox to agree to and consent to the associated cost of the additional cardinality ingestion.
- Click Adjust cardinality budget to apply the changes.

ヒント
From the Manage account cardinality limit pop-up, you can view the change history to track when and by which user the account cardinality was adjusted.
Related topics
Monitor cardinality
Learn how to monitor cardinality usage.
Understand and query high cardinality metrics
Understand the concept of cardinality and learn how to query and analyze high cardinality metrics using NRQL.
Access management
As a Authentication Domain Manager, learn how to manage cardinality related access for users.