This guide is an introduction to improving your skill at diagnosing customer-impacting issues. You'll be able to recover from application performance issues more quickly by following the procedures in this guide.
This guide is part of our series on observability maturity.
Prerequisites
Here are some requirements and some recommendations for using this guide:
- New Relic observability coverage:
- Required : APM with distributed tracing, APM logs in context, and infrastructure agent
- Recommended: Logs and network monitoring (NPM)
- Required: Service level management
- Recommended: Some experience with using New Relic APM, distributed tracing, NRQL querying, and UI
- Recommended: you've read these guides:
Overview
Before you start using this guide, it will help you to understand what you'll be learning. This guide will help you understand:
- How your business is impacted by improving your diagnstics skills.
- The operational key performance indicators used to measure success.
- How your end users perceive different types of reliability issues.
- The difference between the direct cause and the underlying root cause of a problem.
- The basic diagnostic steps for finding and solving problems, which includes:
- Defining the problem - creating a problem statement
- Finding the source of the problem
- Finding the direct cause of that problem
- Some performance problem categories (output performance, input performance, and client performance) and the New Relic features used to diagnose those problems (APM, synthetics, and mobile monitoring).
- How to use a problem matrix, which is a cheat sheet for understanding common problems and their likely sources.
Towards the end, we'll review some example performance problems, which should help you better understand these concepts.
Desired outcomes
Summary
The value to business is:
- Reduce the number of business-disrupting incidents
- Reduce the time required to resolve issues (MTTR)
- Reduce the operational cost of incident
The value to IT operations and SRE is:
- Improve time to understand and resolve
Business outcome
In 2014, Gartner estimated that the average cost of IT downtime was $5,600 per minute. The cumulative cost of business-impacting incidents is determined by factors like time-to-know, frequency, time-to-repair, revenue impact, and the number of engineers triaging and resolving the incidents. Simply put, you want fewer business-impacting incidents, shorter incident duration, and faster diagnostics, with fewer people needed to resolve performance impacts.
Ultimately, the business goal is to maximize uptime and minimize downtime where the cost of downtime is:
Downtime minutes x Cost per minute = Downtime cost
Downtime is driven by the number of business-disrupting incidents and their duration. Cost-of-downtime includes many factors but the most directly measurable are operational cost and lost revenue.
The business must drive a reduction in the following:
- number of business-disrupting incidents
- operational cost of incidents
Operational outcome
The required operational outcome is to maintain product-tier service level objective compliance. You do this by diagnosing degraded service levels, communicating your diagnosis, and performing rapid resolution. But unexpected degradations and incidents always happen and you need to respond quickly and effectively.
In other guides in this series, we focus on improving time to know. In our Alert quality management guide, we focus on reactive ways to improve time to know, and in our Service level management guide we focus on proactive methods.
In the guide you're reading now, we focus on improving time to understand and time to resolve.
Key performance indicators - operational
There are many metrics discussed and debated in the world of “incident management” and SRE theory; however, most agree that it is important to focus on a small set of key performance indicators.
The KPIs below are the most common indicators used by successful SRE and incident management practices.
End-user's perception of reliability
How the customer perceives performance of your product is critical to understanding how to measure urgency, and priority. Also, understanding the customer's perspective helps to understand how the business views the problem, as well as understanding the required workflows to support the impacted capabilities. Once you understand the perception of the customer and the business, you can better understand what might be impacting the reliability of said capabilities.
Ultimately, observability from the customer perspective is the first step to becoming proactive and proficient in reliability engineering.
There are two primary experiences that impact an end-user's perception of the performance of your digital product and its capabilities. The terms below are from the customer's perspective using common customer language.
Root cause vs direct cause
The root cause of a problem is not the same as the direct cause of that problem. Likewise, fixing the direct cause (short term) does not usually mean you've fixed the root cause (long term) of the problem. It's very important to make this distinction.
When looking for a performance issue, you should first attempt to find the direct cause of the problem by asking the question, "What changed?". The component or behavior that changed is not usually the root cause but is in fact the direct cause that you need to resolve first. Resolving the root cause is important but usually requires a post-incident retroactive discussion and long-term problem management.
For example: service levels for your login capability suddenly drop. It's immediately found that traffic patterns are much higher than usual. You trace the performance issue to an open TCP connection limit configuration that's causing a much larger TCP connection queue. You immediately resolve the issue by deploying a TCP limit increase and some extra server instances. You solved the direct cause of the problem for the short term but the root cause could be anything from improper capacity planning, missed communication from marketing, or a related deployment with uninteded consequences on upstream loads.
This distinction is also made in ITIL/ITSM Incident management versus Problem management. Root causes are discussed in post-incident talks then resolved in longer-term problem management processes.
Diagnostic steps (overview)
Step 1: Define the problem
The first rule is to quickly establish the problem statement. There are plenty of guides on building problem statements but simple and effective is the best. A well formed problem statement will do the following:
- Describe what the end-user is experiencing. What is the problem that the end-user is experiencing?
- Describe the expected behavior of the product capability. What is it that the end-user should be experiencing?
- Describe the current behavior of the product capability. What is the technical assessment of what the user is experiencing?
Avoid any assumptions in your problem statement. Stick to the facts.
Step 2: Find the source
The "source" is the component or code that is closest to the direct cause of the problem.
Think of many water pipes connected through many junctions, splitters, and valves. You're alerted that your water output service level is degraded. You trace the problem from the water output through the pipes until you determine which junction, split, valve, or pipe is causing the problem. You discover one of the electric valves is shorted. That valve is the source of your problem. The short is the direct cause of your problem. You easily resolve the direct cause by replacing the value. Bear in mind the root cause may be something more complex, such as weather conditions, chemicals in the water, or the manufacture.
This is the same concept for diagnosing complex technology stacks. If your login capability is limited (output), you must trace the problem back to the component (source) that's causing that limit and fix it. It could be the API software (service boundary), the middleware services, the database, resource constraints, a third party service, or something else.
In IT there are three primary breakpoint categories to improve your response times:
Output
Input
Client
Defining your performance metrics within these categories, a.k.a service levels, will significant improve your response time in determining where the source of the problem is. Measuring these categories is covered in our service level management guide. To understand how to use them in diagnostics, keep reading.
Step 3: Find the direct cause
Once you're close to the source of the problem, determine what changed. This will help you quickly determine how to immediately resolve the problem in the short term. In the example in Step 2, the change was that the valve was no longer functioning due to degraded hardware causing a short.
Examples of common changes in IT are:
- Throughput (traffic)
- Code (deployments)
- Resources (hardware allocation)
- Upstream or downstream dependency changes
- Data volume
For other common examples of performance-impacting problems, see the problem matrix below.
Use health data points
As previously mentioned, there are three primary performance categories that jump-start your diagnostic journey. Understanding these health data points will significantly reduce your time to understanding where the source of the problem is.
Problem matrix
The problem matrix is a cheat-sheet of common problems categorized by the three health data points.
The problem sources are arranged by how common they are, with the most common being in the top row and on the left. A more detailed breakdown is listed below. Service level management done well will help you rule out two out of three of these data points quickly.
This table is a problem matrix sorted by health data point:
Data point | New Relic capability | Common problem sources |
|---|---|---|
Output | APM, infra, logs, NPM | Application, data sources, hardware config change, infrastructure, internal networking, third party provider (AWS, GCP) |
Input | Synthetic, logs | External routing (CDN, gateways, etc), internal routing, things on the internet (ISP, etc.) |
Client | Browser, mobile | Browser or mobile code |
Problems tend to be compounded but the goal is to "find the source" and then determine "what changed" in order to quickly restore service levels.
Example problems
Let's look at an example problem. Let's say your company deploys a new product, and the significant increase in requests causes unacceptable response times. The source is discovered in the login middleware service. The problem is a jump in TCP queue times.
Here's a breakdown of this situation:
- Category: output performance
- Source: login middleware
- Direct cause: TCP queue times from additional request load
- Solution: increased TCP connection limit and scaled resources
- Root-cause: insufficient capacity planning and quality assurance testing on downstream service impacting login middleware
Another example problem
Here's another example problem:
- There was a sudden increase in 500 Gateway errors on login...
- The login API response times increased to the point where timeouts began...
- The timeouts were traced to the database connections in the middleware layer...
- Transaction traces revealed signficant increase in number of database queries per login request...
- A deployment marker was found for a deployment that happened right before the problem.
Here's a breakdown of this situation:
- Category: output performance degredation leading to input performance failure
- Source: middleware service calling database
- Direct cause: 10x increased database queries after code deployment
- Solution: deployment rollback
- Root-cause: insufficient quality assurance testing
Problem matrix by source
Here's a table with the problem matrix sorted by sources.
Source | Common direct causes |
|---|---|
Application |
|
Data source |
|
Internal networking and routing |
|
Identifying performance pattern anomalies
Sugerencia
Having well-formed service levels on your service boundaries relating to key transactions (capabilities) will help you more quickly identify what end-to-end workflow the problem resides in.
Identifying pattern anomalies will improve your ability to identify what and where the direct cause of problems may be.
There's plenty of great information and free online classes on identifying patterns, but the general concept is rather simple and can unlock powerful diagnostic abilities.
The key to identifying patterns and anomalies in performance data is that you don't need to know how the service should be performing: You only need to determine if the recent behavior has changed.
The examples provided in this section use response time or latency as the metric but you can apply the same analysis to almost any dataset, such as errors, throughput, hardware resource metrics, queue depths, etc..
Normal
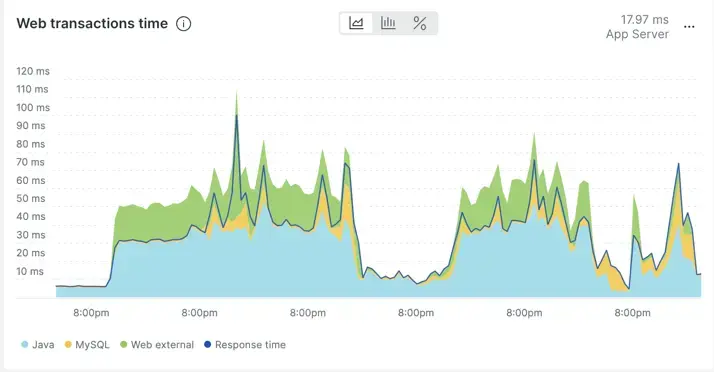
Below is an example of a seemingly volatile response time chart (7 days) in APM. Looking closer, you can see that the behavior of the response time is repetitive. In other words, there's no radical change in the behavior across a 7-day period. The spikes are repetitive and not unusual compared to the rest of the timeline.

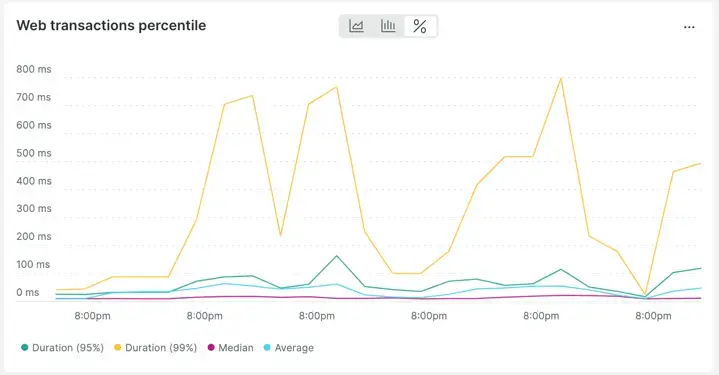
In fact, if you change the view of the data from average over time to percentiles over time, it becomes even more clear how "regular" the changes in response time are.

Abnormal
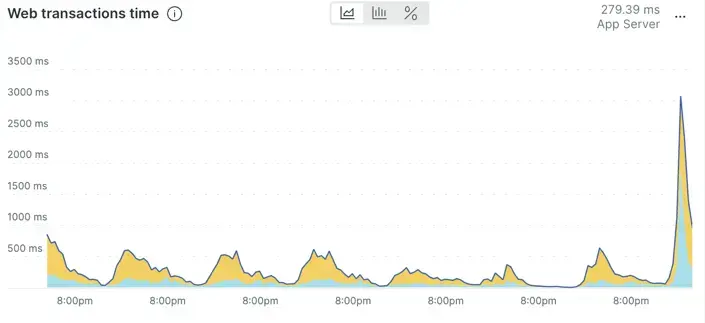
This chart shows an application response time that seems to have increased in an unusual way compared to recent behavior.

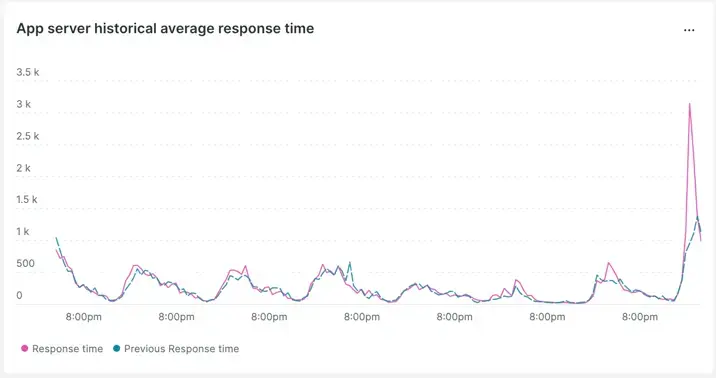
This can be confirmed by using the week-over-week comparison.

We see that the pattern has changed and that it appears to be worsening from last week's comparison.
Finding the source
Next, we'll walk through how you'd find the source in New Relic. Note that this workflow relies on distributed tracing.
First, you'll find an application related to the latency or errors experienced by the end user. This doesn't mean the application or the code is the problem, but finding any application within the flow (first) leads you more quickly close to the source. Once this application is found, you can quickly rule out components like code, host, database, configuration, and network.
Once the application is identified, the question is what transactions within that application are part of the problem. Use the application you identified as experiencing a performance issue and identify which transaction or transactions are impacted. Here you may repeat the performance pattern anomoly skill described above in Identif performance pattern anomalies, but this time on the transactions themselves.
The following docs will help you use New Relic to identify problem transactions:
Once the problematic transactions are identified, you can use distributed tracing to review the end-to-end components supporting that transaction. Distributed tracing helps you quickly identify where the latency is and/or where the errors are occurring across your entire stack, all within one view.
The following resources will help you learn how to use distributed tracing to identify the source problem component:
- Intro to distributed tracing
- How to use the distributed tracing UI
- Free online webinars on distributed tracing
- A video on using distributed tracing for direct cause analysis
Here's a brief summary of the finding-the-source steps:
- Examine an application related to the impacted performance.
- Identify which transactions are contributing to the problem.
- Use distributed tracing to identify the problem component within the end-to-end flow.
We can now move on to the final step, identifying the direct cause.
Finding the direct cause
Once the source component is found you can begin to determine the direct cause.
Using knowledge from the previous steps you'll know if the problem is latency, success, or both.
Latency issues can be found using transaction traces and/or "in-process spans" within distributed traces.
Success issues error messages can also be seen in traces, but the best details for success problems are usually found in the application logs.
Either way, if you're the first tier incident responder or an SRE, finding the direct cause would fall to the subject matter experts (SMEs), who are typically the developers and engineers responsible for the source component found.
The most effective next step after discovering the source component is to contact the subject matter experts for said component. Show them the data discovered in the triage and diagnostics you've completed for a head start on the troubleshooting.
Sugerencia
Note that both logs-in-context and distributed tracing are enabled by default with our newest agents. (If you haven't updated your agents in a while, we recommend regularly updating your agents.)
Logs-in-context and distributed tracing are critical capabilities required to reduce your time in triage, diagnostics and long-term problem resolution.
Now, go forth and be an excellent site reliability engineer with New Relic!
Next steps
If you haven't already, you might want to read up on some of our related observability maturity guides, including: