Distributed tracing helps you monitor and analyze the behavior of your distributed system. After you enable distributed tracing, you can use our UI tools to search for traces and analyze them.
If you're looking to troubleshoot errors in a transaction that spans many services:
Sort through your traces using a filter to find that specific request and show only traces containing errors.
On the trace details page, review the span along the request route that originated the error.
Noting the error class and message, navigate to the service from its span in the trace so you can see that the error is occurring at a high rate.
Sugerencia
Working with asynchronous traces?
If your traces get split across asynchronous boundaries like message queues or event streams, you can use span links to navigate between causally related traces. Span links help you understand the complete request flow even when traces are disconnected. Learn more about understanding span links.
Read on to explore the options in the distributed tracing UI.
We have a variety of tools to help you find traces and spans so you can resolve issues. The opening distributed tracing page is populated with a default list of traces. You can quickly refine this list using these tools:
The Find traces query bar is a quick way to narrow your search for traces. You can either start typing in the query bar or use the dropdown to create a compound query.
Query returns are based on span attributes, not on trace attributes. You define spans that have certain criteria, and the search displays traces that contain those spans.
If you use a multi-attribute filter, it is affected by first attribute selected. Distributed tracing reports on two types of data: transaction events and spans. When you select an attribute in the filter, the data type that attribute is attached to dictates the available attributes. For example, if you filter on an attribute that is attached to a transaction event, only transaction event attributes are available when you attempt to add filter on additional attribute values.
Queries for traces are similar to NRQL (our query language), with a few main exceptions:
String values don't require quote marks (for example, you can use either appName = MyApp or appName = 'MyApp')
The like operator doesn’t require % (for example, you can use either appName like product or appName like %product%).
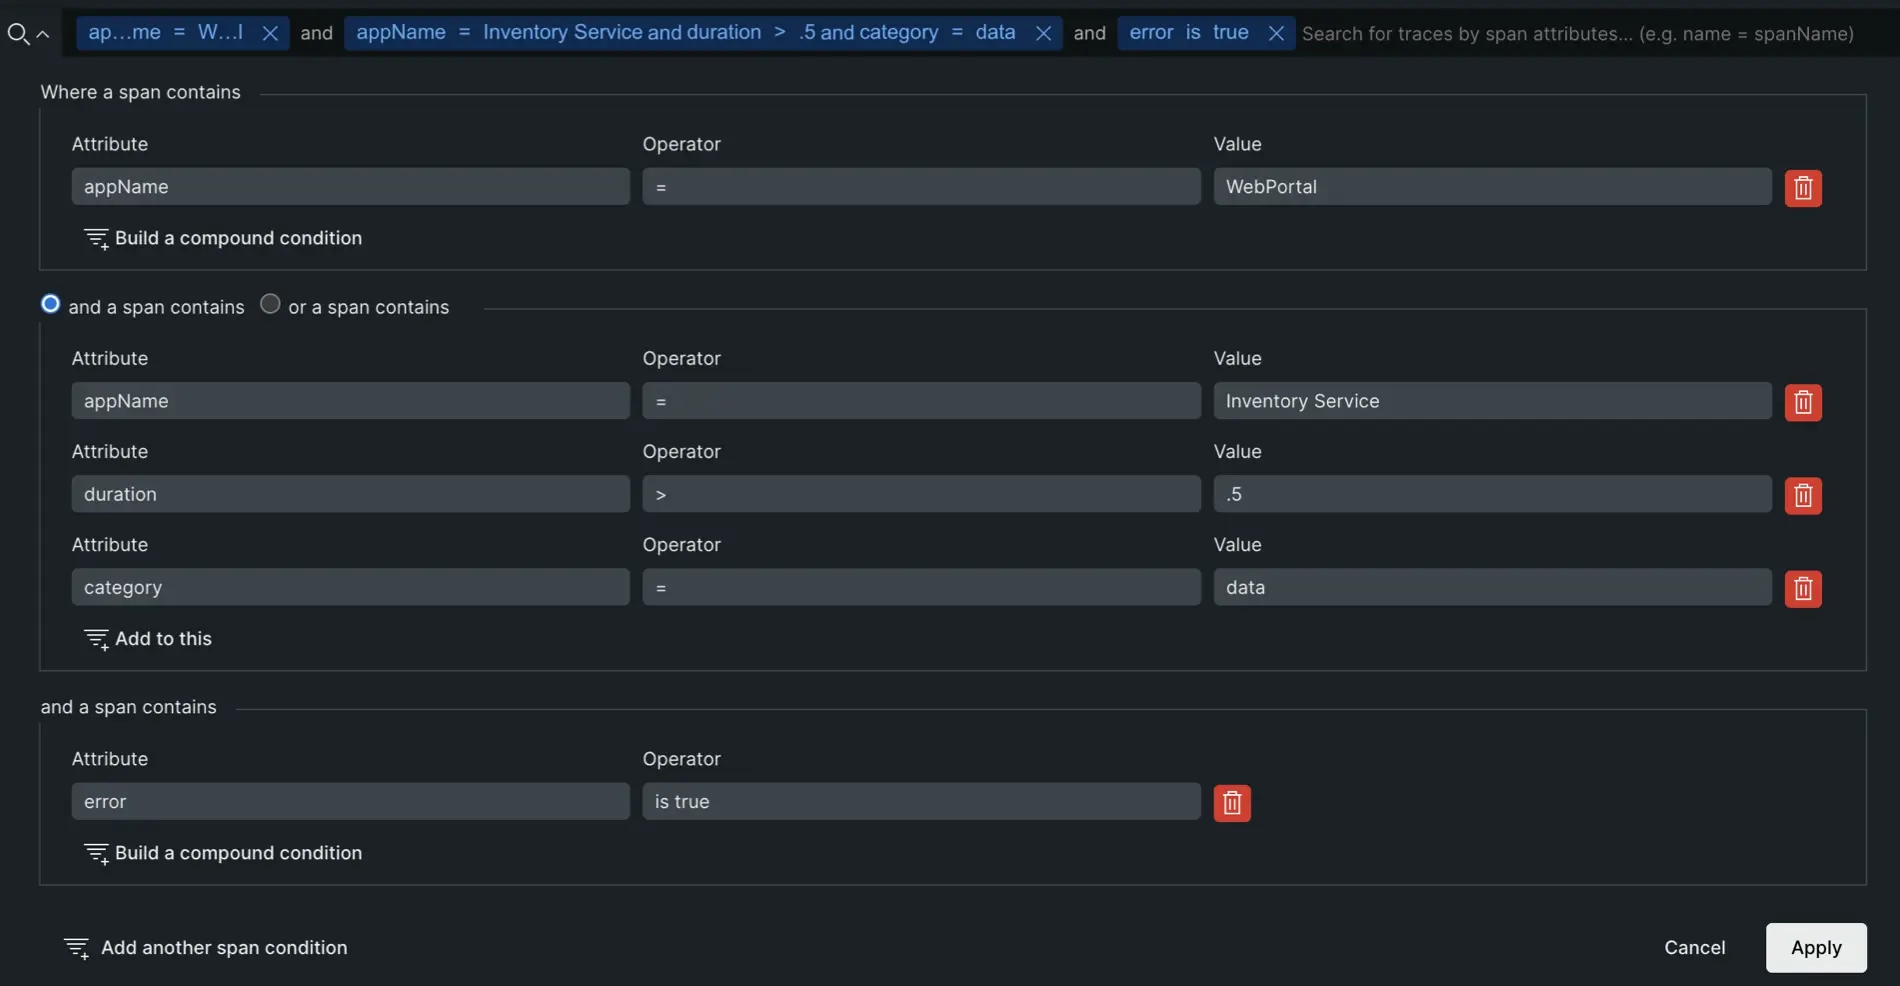
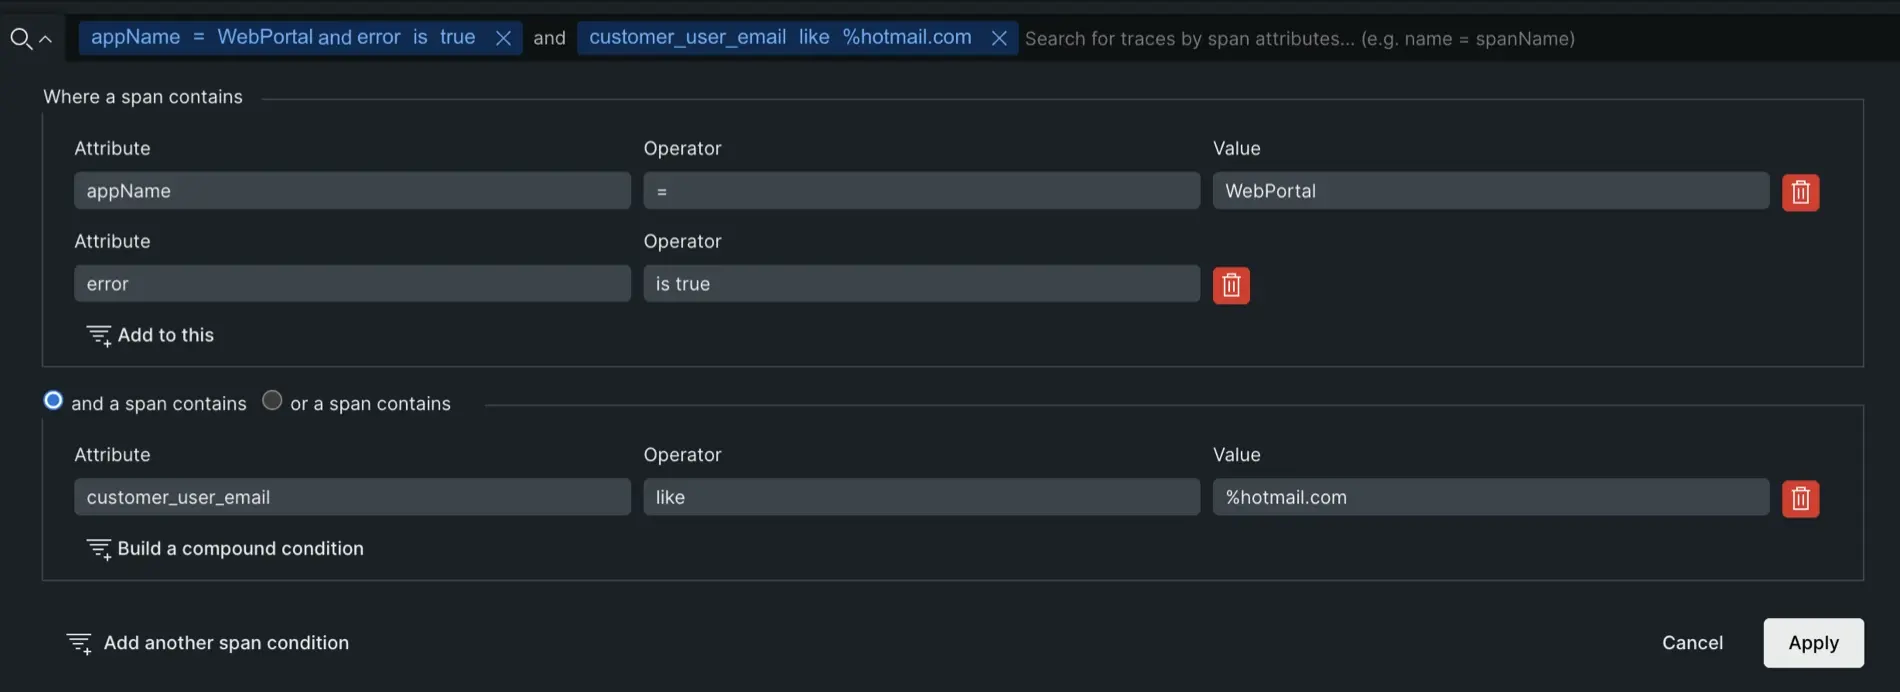
These are two examples of how to use the query bar:
The query in the image below finds traces that:
Pass through both WebPortal and Inventory Service applications
Have an Inventory Service datastore call that takes longer than 500 ms
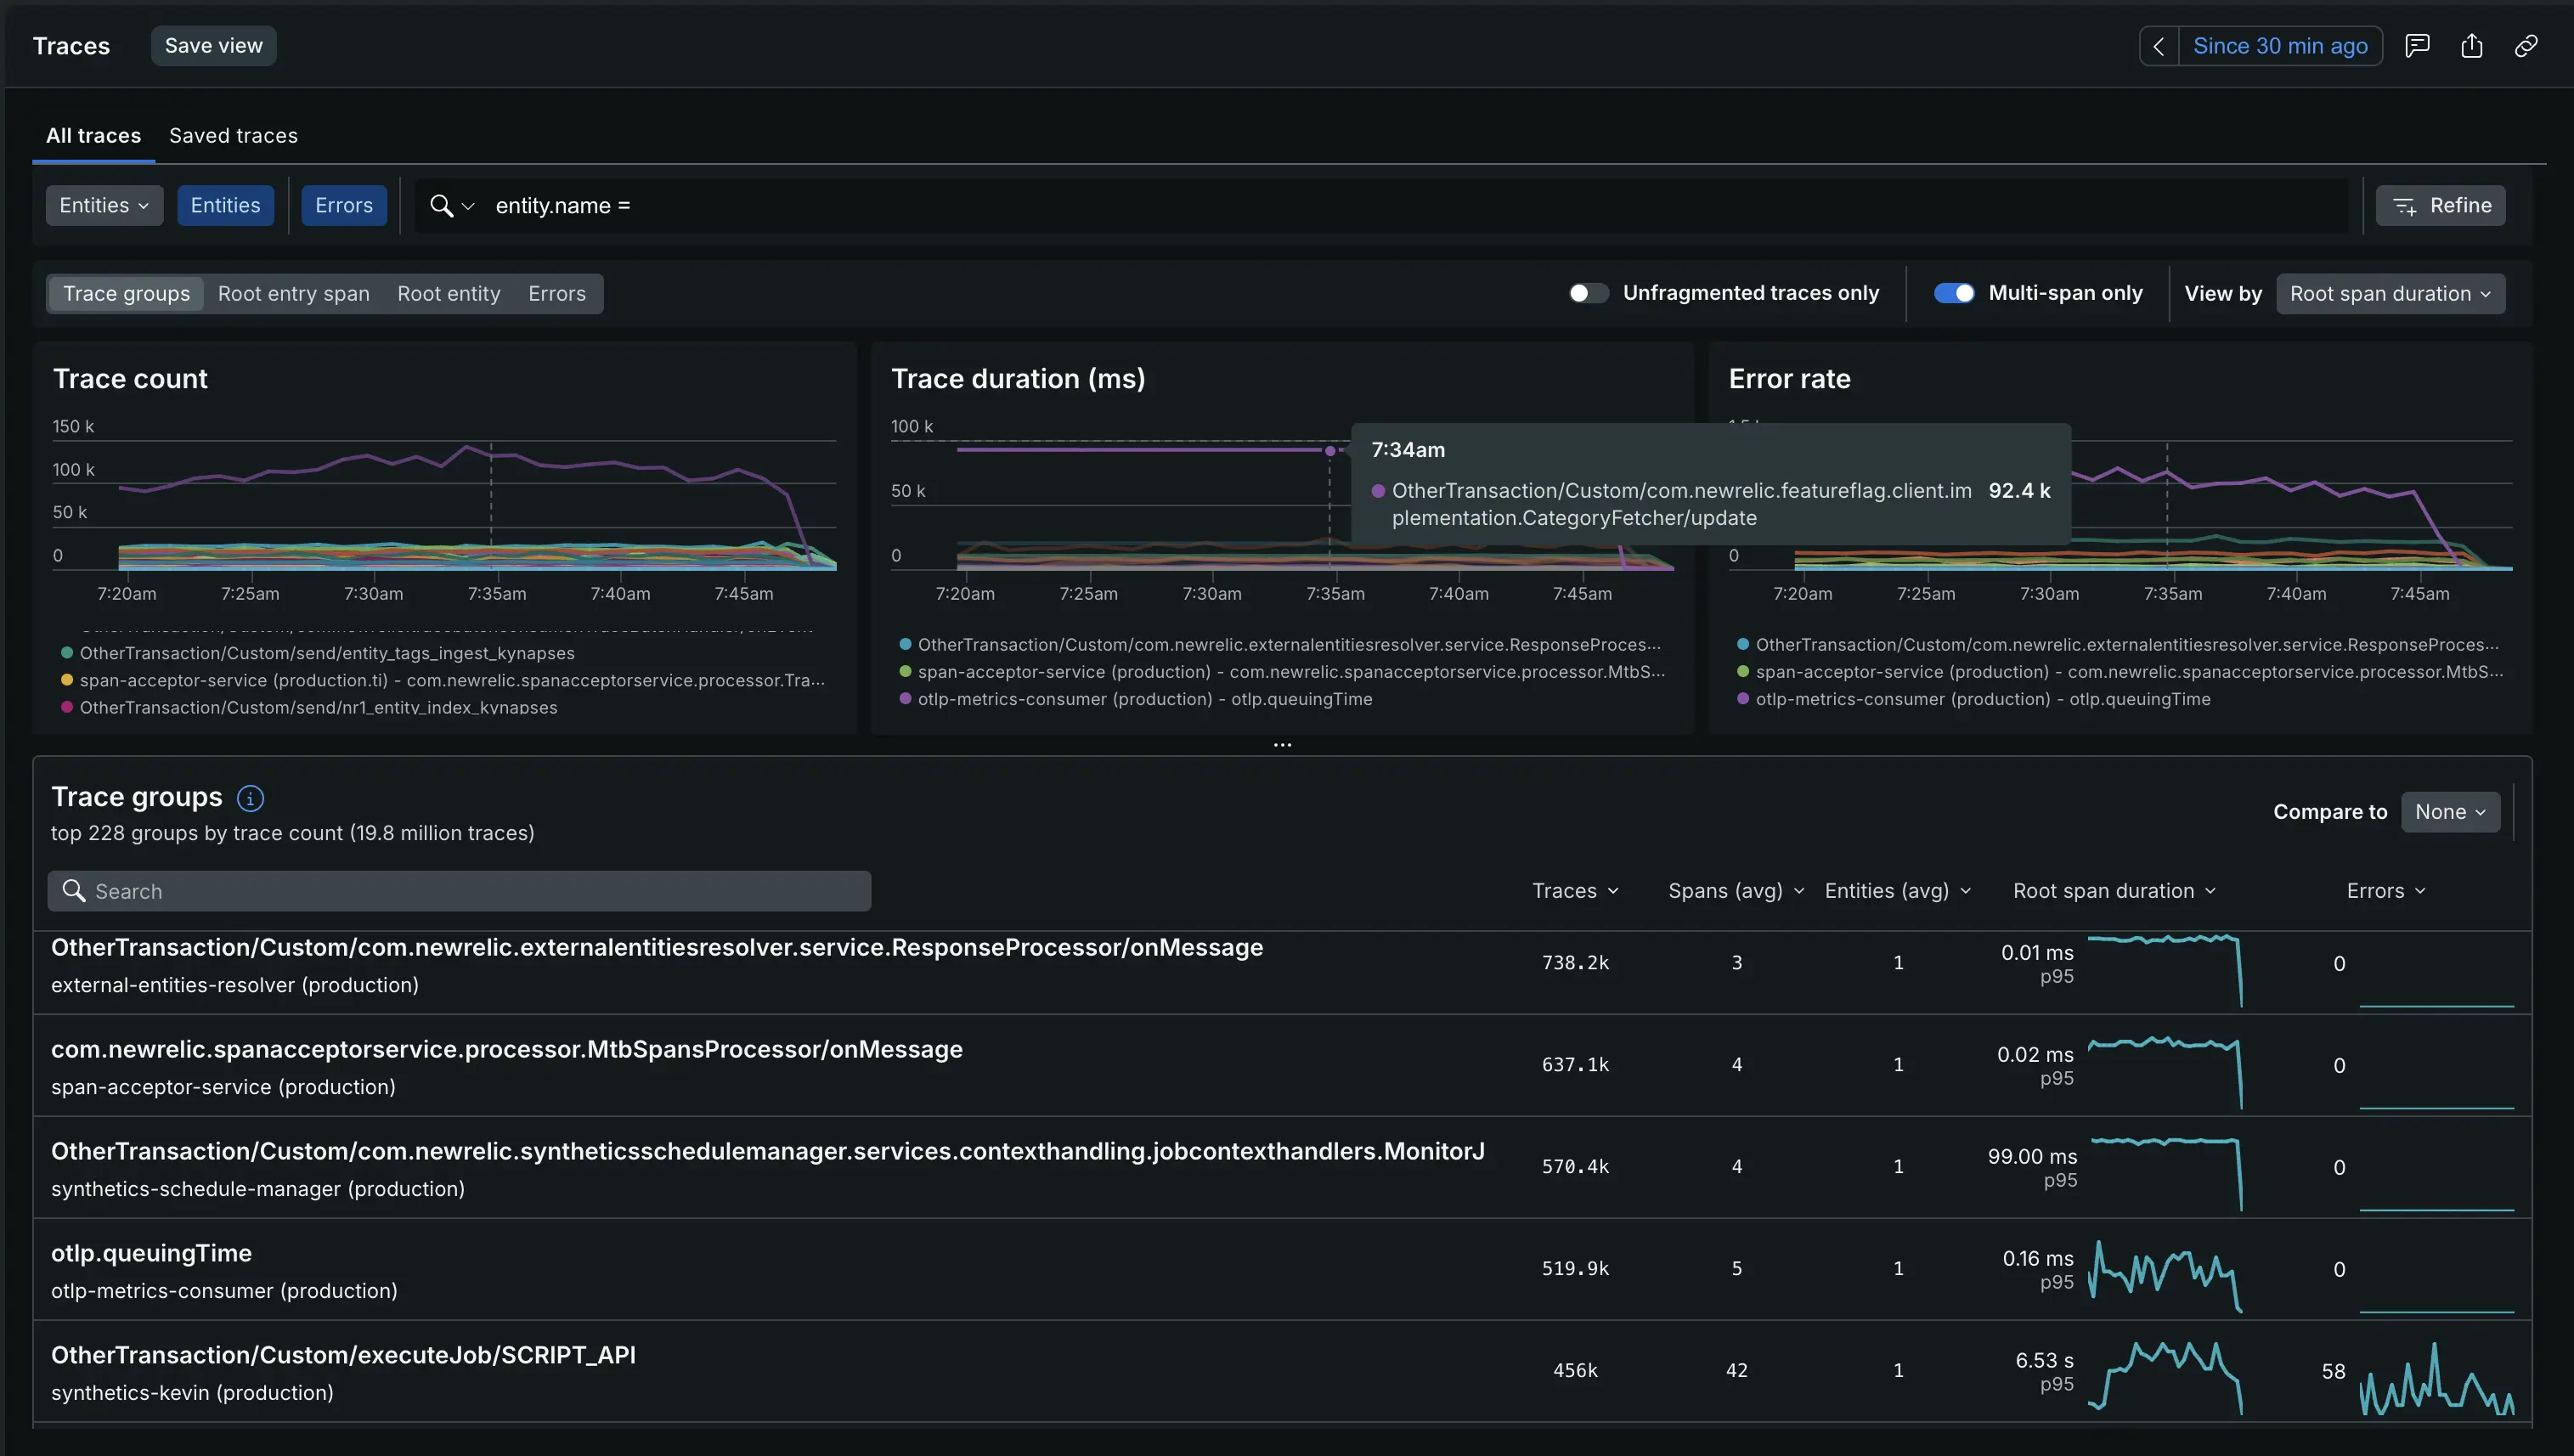
Besides the query bar at the top of the page, you can use the inline filter pills and toggles to narrow your trace list.
Entities: Use the entities dropdown to filter traces by specific entities in your system.
Errors: Select this pill to show only traces that contain errors.
Refine: Click Refine on the right side of the filter bar to access additional filtering options.
Unfragmented traces only: Turn on this toggle to hide fragmented traces and show only complete traces.
Multi-span only: Turn on this toggle to hide single-span traces and show only traces with multiple spans.
Organize your span data
The Trace groups tab is the default view of distributed tracing. It groups traces by their root entry span — the span where New Relic began recording the request.
With trace groups you get a high-level view of traces so you can understand request behavior for groups of similar traces. This helps you understand dips or spikes in trace count, duration, and errors. When you click on one of the trace groups, you get all the standard details in context of the specific trace group you selected.
When on the Trace groups tab, you'll see three summary charts at the top of the page: Trace count, Trace duration (ms), and Error rate. Each chart is broken down by trace group. Below the charts, a table lists the top groups by trace count with columns for traces, average spans, average entities, root span duration, and errors.
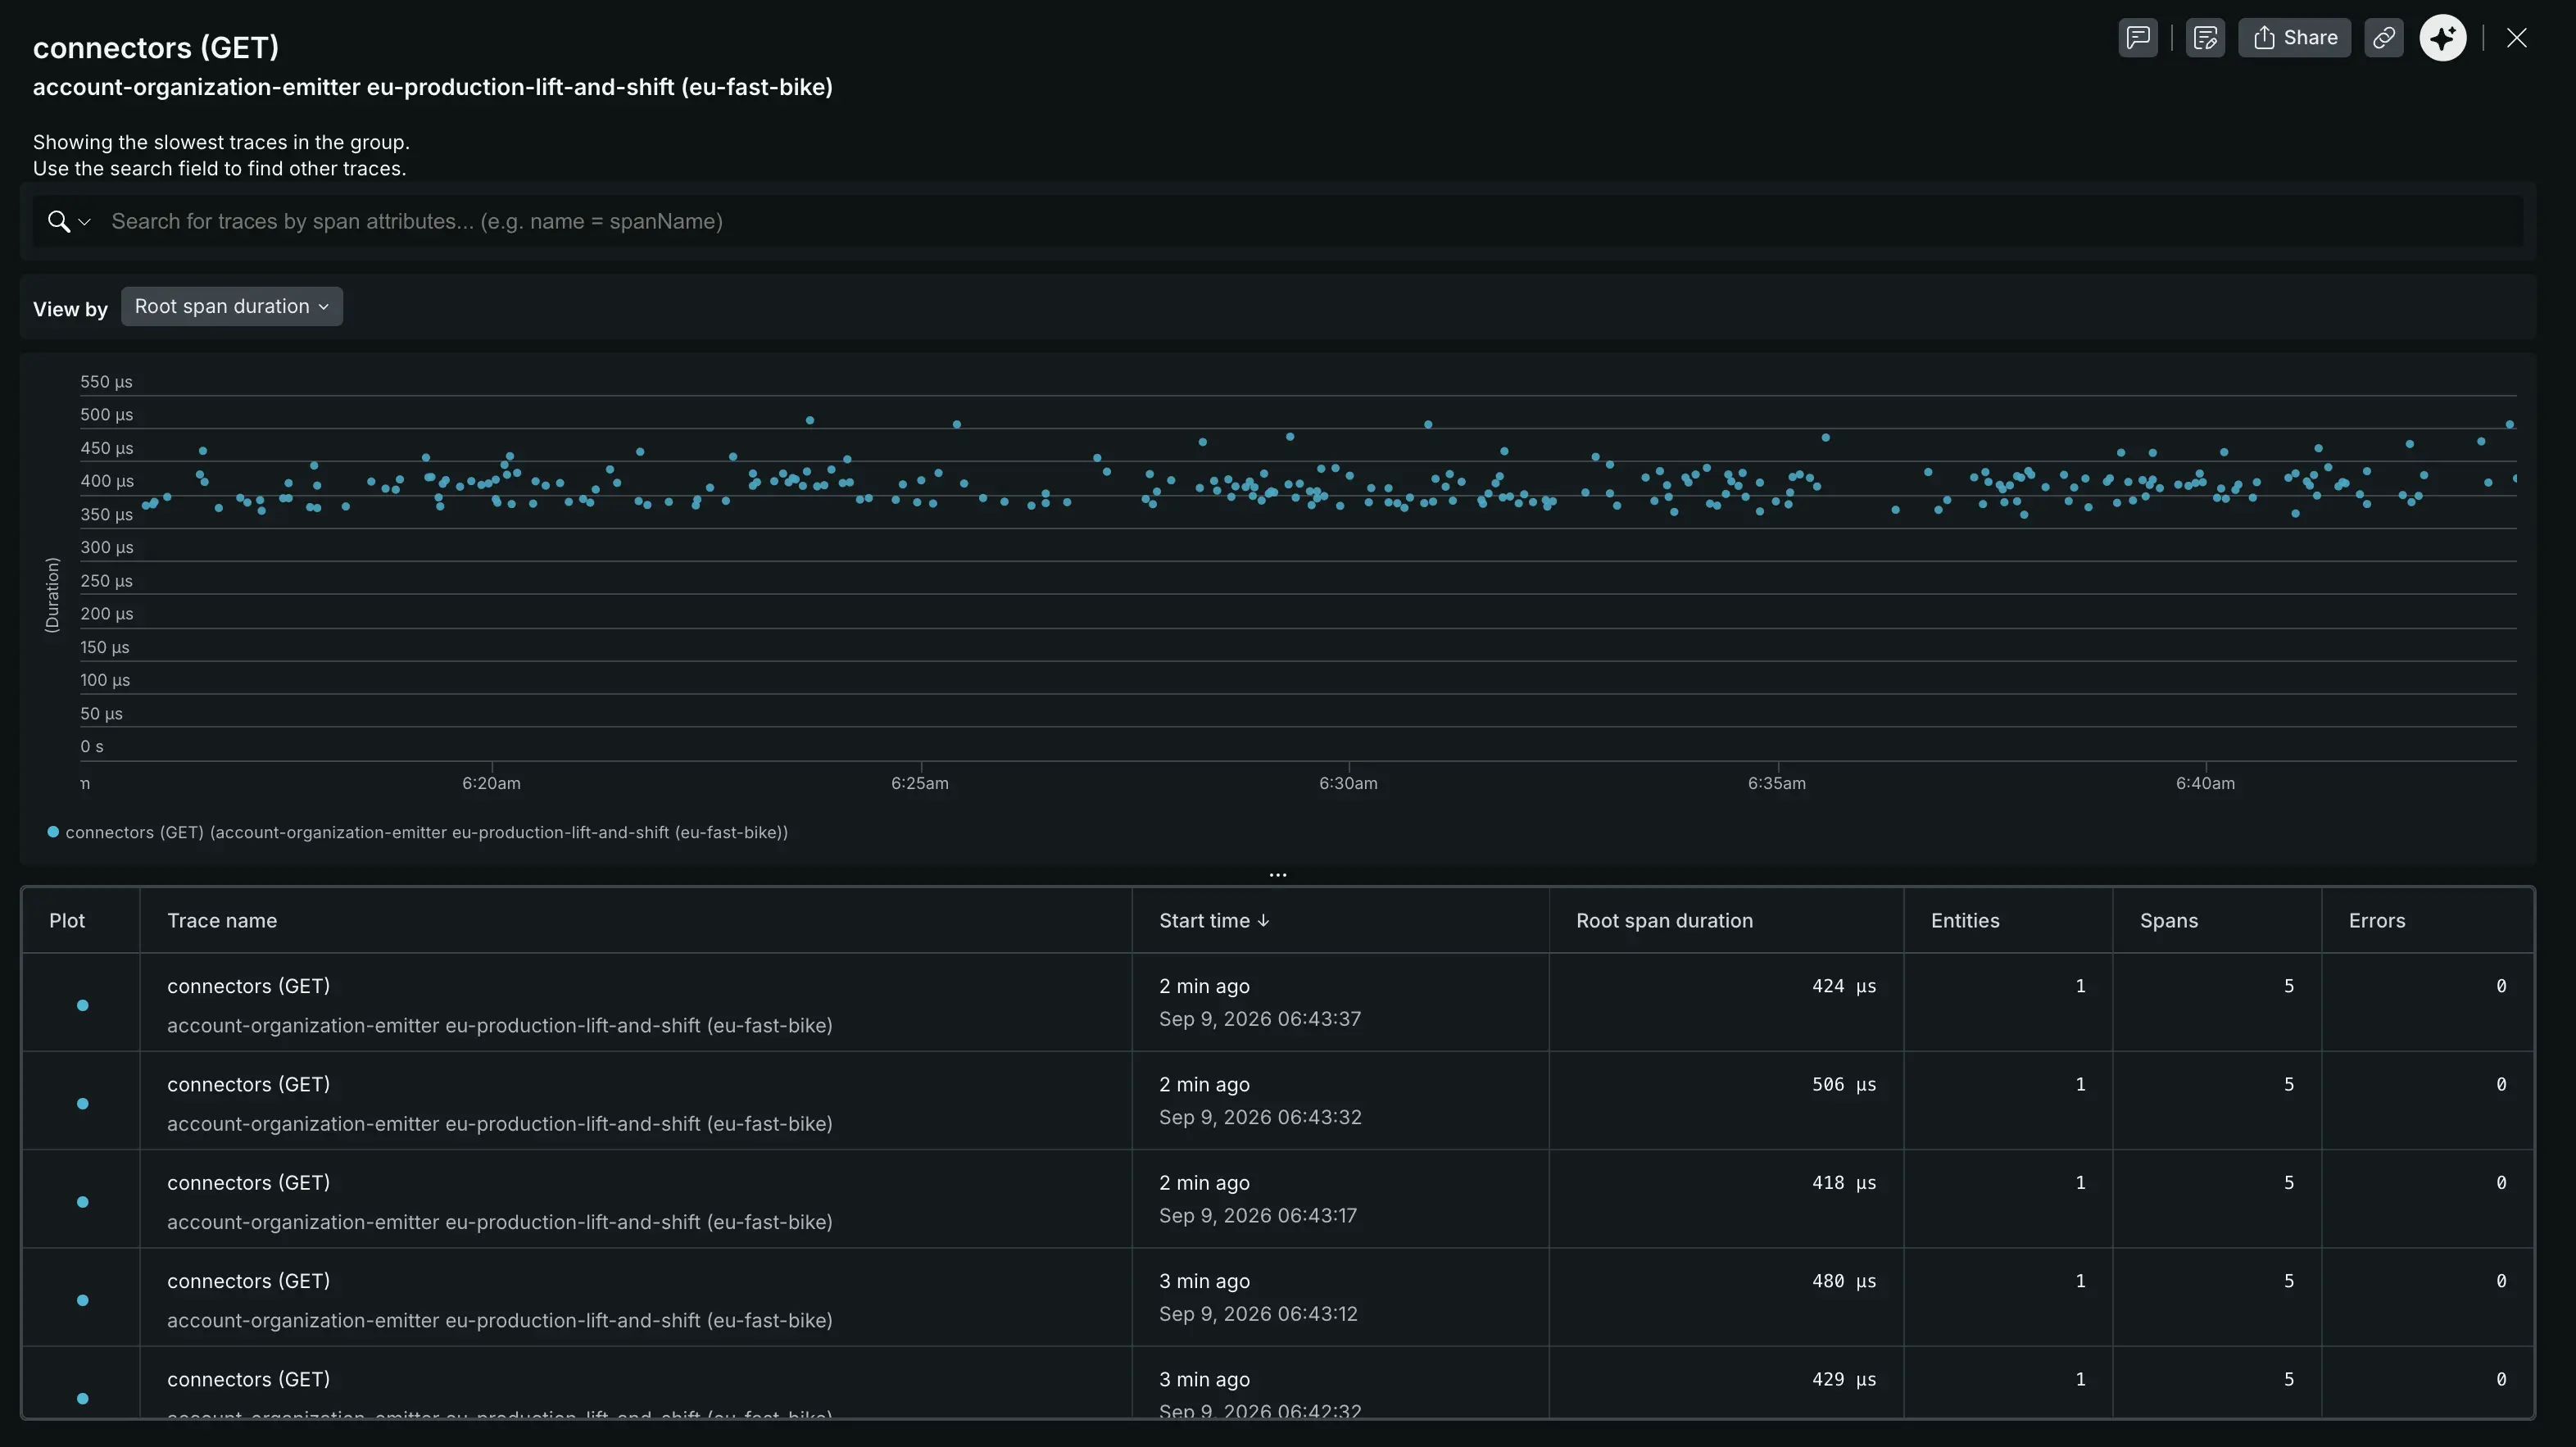
The trace scatter plot is a quick way to search for outlying traces. It is available when you select the Root entry span, Root entity, or Errors tab at the top of the trace list.
In the scatter plot, you can move the cursor across the chart to view trace details and you can click individual points to get details:
Control what's displayed in the scatter plot:
Select the duration type in the View by dropdown:
Backend duration
Root span duration
Trace duration
In Facet traces by, select one of these options:
Root entry span: Group by the root transaction, which is the root service's endpoint. In a trace where Service A calls Service B and Service B calls Service C, the root entry span is Service A's endpoint. For example: "Service A - GET /user/%".
Root entity: Group by the name of the first entity in traces. In a trace where Service A calls Service B and Service B calls Service C, the root entity would be Service A.
Errors: Group by whether or not traces contain errors.
To further narrow the traces shown in the scatter plot, use the inline filter pills and toggles at the top of the page.
Sugerencia
Some queries that produce many results may result in false positives in charts. This could manifest as charts showing trace results that are not in the trace list.
Additional UI details
Here are some additional distributed tracing UI details, rules, and limits:
Span-level errors show you where errors originated in a process, how they bubbled up, and where they were handled. Every span that ends with an error is shown with an error in the UI and contributes to the total error count for that trace.
Here are some general tips about understanding span errors:
Spans with errors are highlighted red in the distributed tracing UI. You can see more information on the Error Details pane for each span.
All spans that exit with errors are counted in the span error count.
When multiple errors occur on the same span, only one is written to the span in this order of precedence:
A noticeError
The most recent span error within the scope of that span
This table describes how different span errors are handled:
Error type
Description
Spans ending in errors
An error that leaves the boundary of a span results in an error on that span and on any ancestor spans that also exit with an error, until the error is caught or exits the transaction. You can see if an error is caught in an ancestor span.
Notice errors
Errors noticed by calls to the agent noticeError API or by the automatic agent instrumentation are attached to the currently executing span.
Response code errors
Response code errors are attached to the associated span, such as:
Client span: External transactions prefixed with http or db.
Entry span: In the case of a transaction ending in a response code error.
The response code for these spans is captured as an attribute http.statusCode and attached to that span.
OpenTelemetry Errors
The Error Details box of the right pane is populated by spans containing otel.status_code = ERROR and displays the content of otel.status_description.
Sugerencia
OpenTelemetry span events handled by the app/service are displayed independently of span error status and are not necessarily associated with a span error status. You can view span event exceptions and non-exceptions by clicking View span events in the right pane.
If a span is displayed as anomalous in the UI, it means that the following are both true:
The span is more than two standard deviations slower than the average of all spans with the same name from the same service over the last six hours.
The span's duration is more than 10% of the trace's duration.
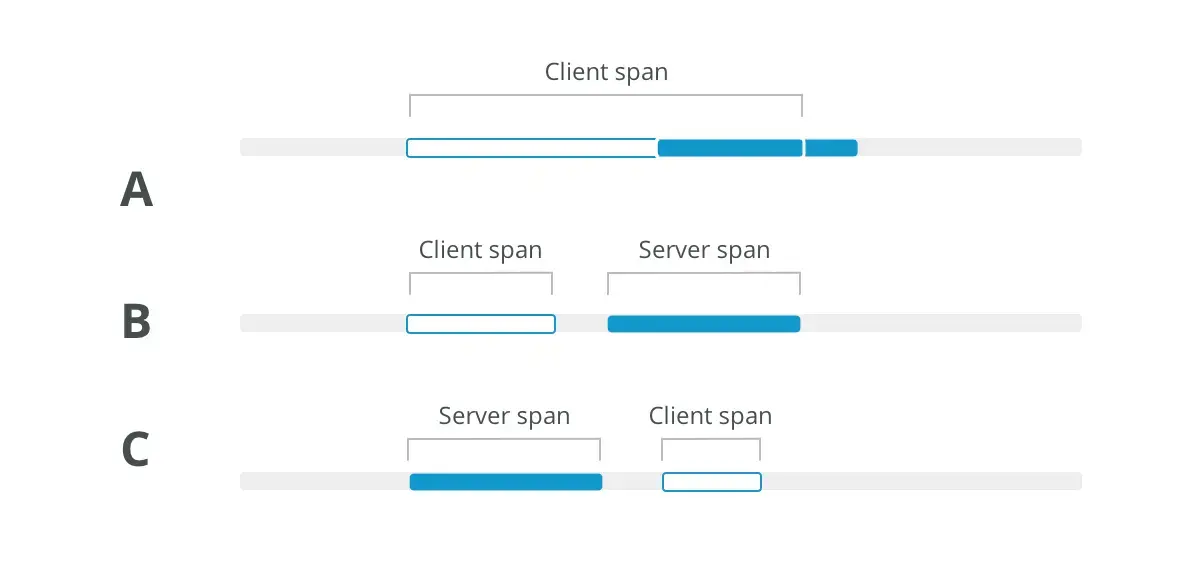
When a process calls another process, and both processes are instrumented by New Relic, the trace contains both a client-side representation of the call and a server-side representation. The client span (calling process) can have time-related differences when compared to the server span (called process). These differences could be due to:
Clock skew, due to system clock time differences
Differences in duration, due to things like network latency or DNS resolution delay
The UI shows these time-related differences by displaying an outline of the client span in the same space as the server span. This span represents the duration of the client span.
It isn't possible to determine every factor contributing to these time-related discrepancies, but here are some common span patterns and tips for understanding them:
A. When a client span is longer than the server span, this could be due to latency in a number of areas, such as: network time, queue time, DNS resolution time, or from a load balancer that we cannot see.
B. When a client span starts and ends before a server span begins, this could be due to clock skew, or due to the server doing asynchronous work that continues after sending the response.
C. When a client span starts after a server span, this is most likely clock skew.
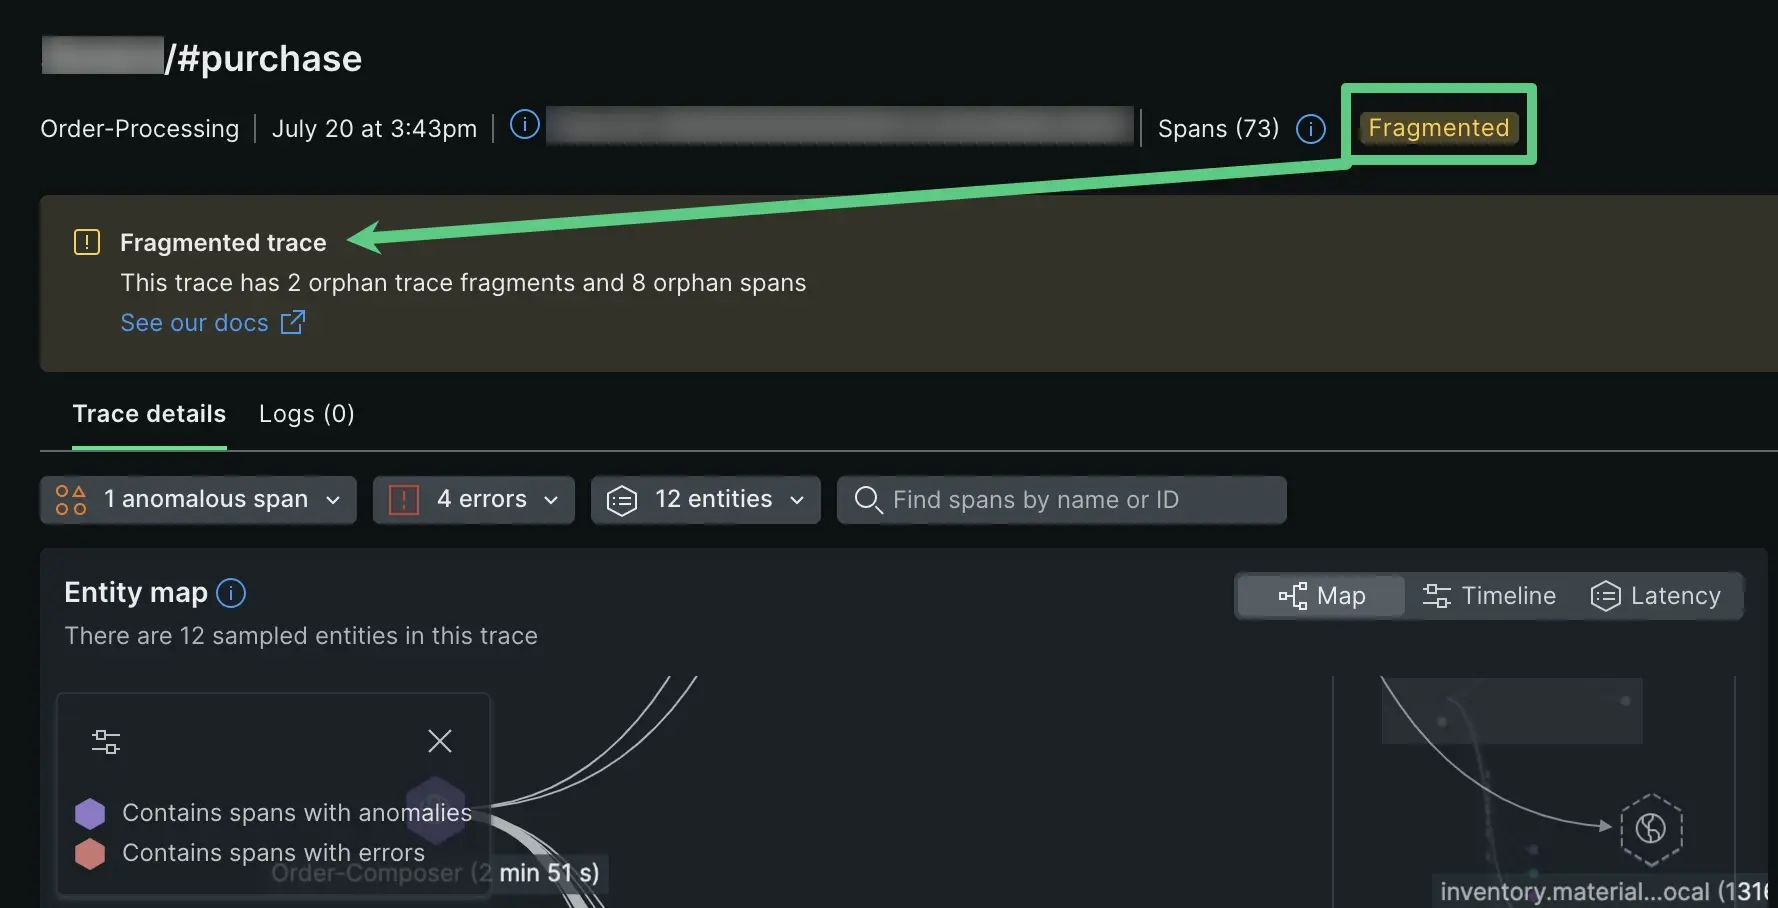
Fragmented traces are traces with missing spans. When a span is missing or has invalid parent span IDs, its children spans become separated from the rest of the trace, which we refer to as "orphaned." Orphaned spans appear at the bottom of the trace, and they will lack connecting lines to the rest of the trace. If you have fragmented spans, you'll see the word Fragmented at the top of the details page:
Types of orphaned span properties indicated in the UI:
No root span. Missing the root span, which is the first operation in the request. When this happens, the span with the earliest timestamp is displayed as the root.
Orphaned span. A single span with a missing parent span. This could be due to the parent span having an ID that doesn't match its child span.
Orphaned trace fragment. A group of connected spans where the first span in the group is an orphan span.
This can happen for a number of reasons, including:
Collection limits. Some high-throughput applications may exceed collection limits (for example, APM agent collection limits, or API limits). When this happens, it may result in traces having missing spans. One way to remedy this is to turn off some reporting, so that the limit is not reached.
Incorrect instrumentation. If an application is instrumented incorrectly, it won't pass trace context correctly and this will result in fragmented traces. To remedy this, examine the data source that is generating orphan spans to ensure instrumentation is done correctly. To discover a span's data source, select it and examine its span details.
Spans still arriving. If some parent spans haven't been collected yet, this can result in temporary gaps until the entire trace has reported.
UI display limits. Orphaned spans may result if a trace exceeds the 10K span display limit.
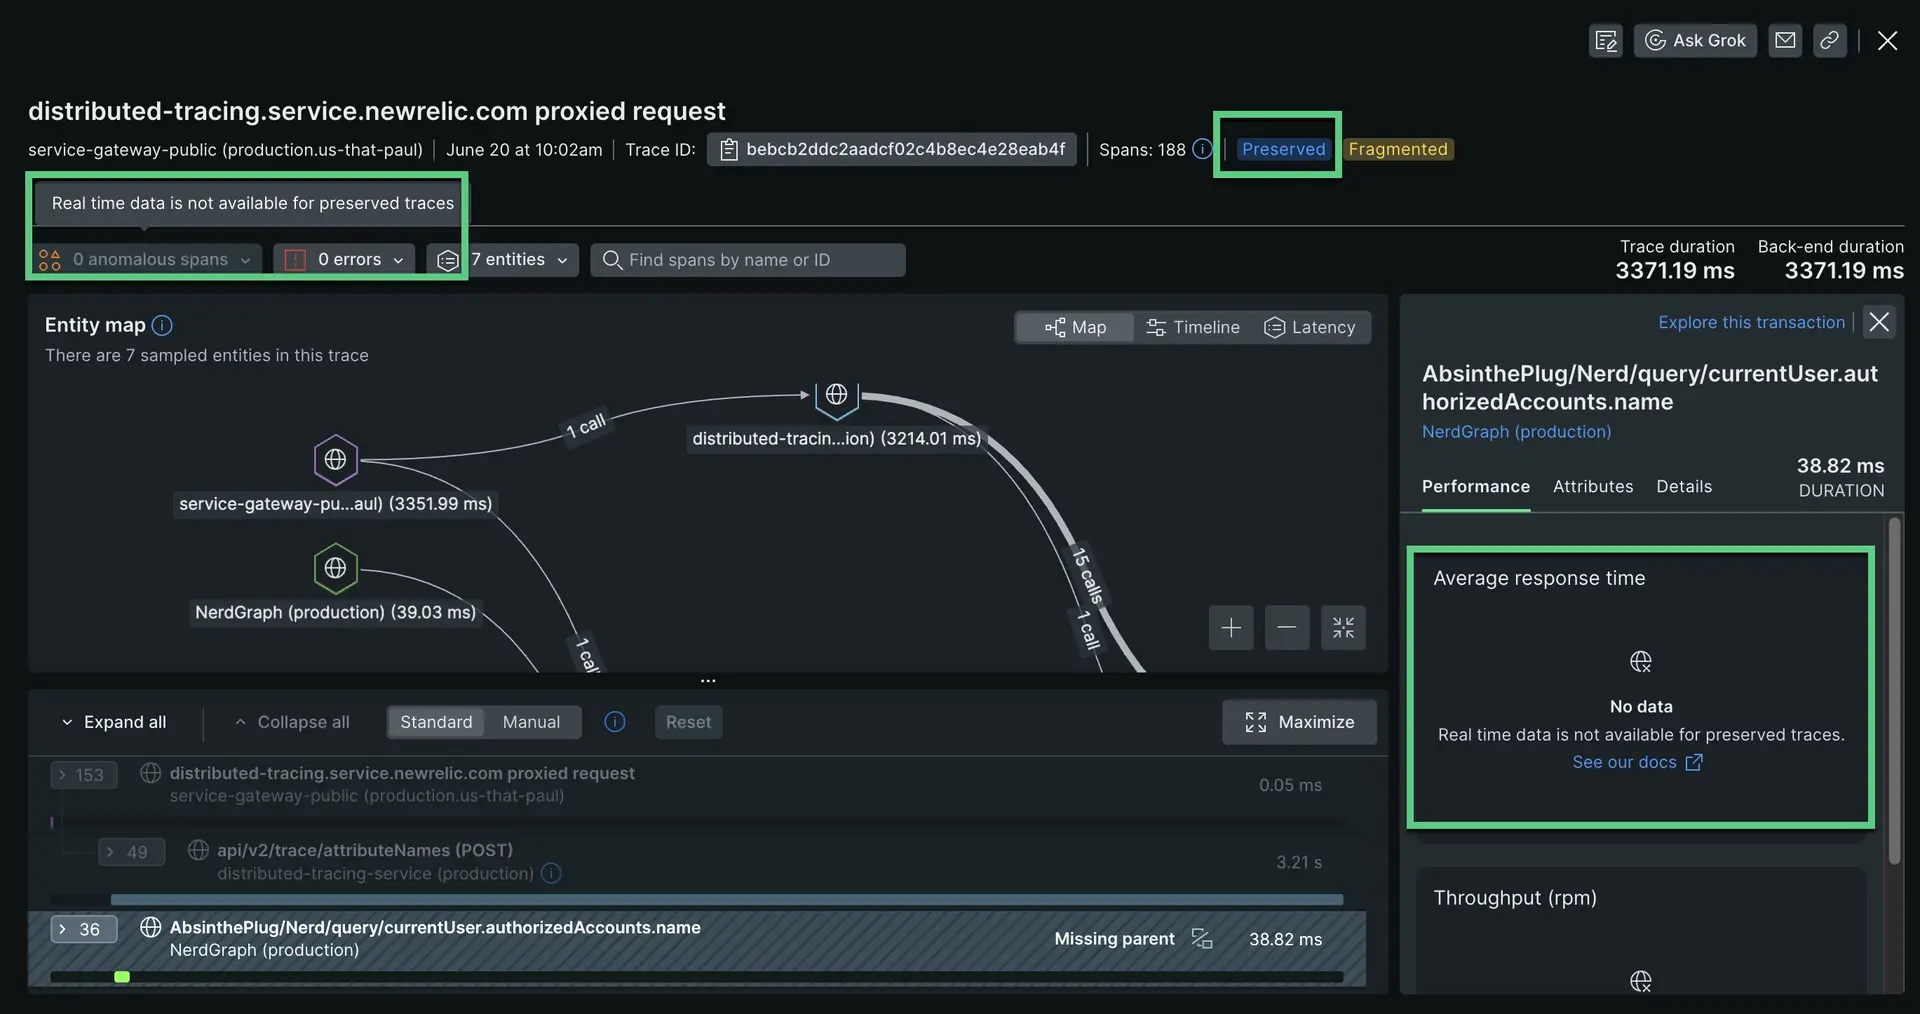
Preserved traces are similar to snapshots of original traces. They archive a full trace that has been previously viewed and has surpassed the retention period. Full traces are only available for 7 days, unless you've purchased extended retention (which would reflect automatically in the UI). However, preserved traces can exist for up to 1 year, and generally function like the original trace.
Note that preserved traces won't display span performance data or span anomaly data. Preserved traces may not be accessible if an entity in a preserved trace is deleted, expires, or stops reporting data.
If you don’t have access to the New Relic accounts that monitor other services, some of the span and service details will be obfuscated in the UI. Obfuscation can include:
Span name concealed by asterisks
Service name replaced with New Relic account ID and app ID
For more information on the factors affecting your access to accounts, see Account access.
When viewing the span waterfall, span names may be displayed in an incomplete form that is more human-readable than the complete span name. To find the complete name, select that span and look for the Full span name. Knowing the complete name can be valuable for querying that data with NRQL.
A trace may sometimes have (or seem to have) missing spans or services. This can manifest as a discrepancy between the count of a trace's spans or services displayed in the trace list and the count displayed on the trace details page.
Reasons for missing spans and count discrepancies include: