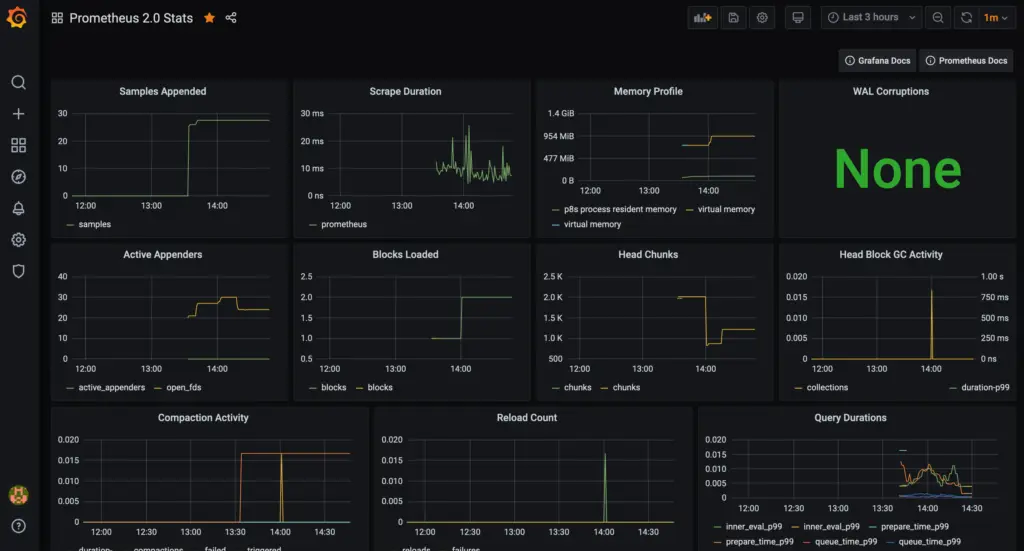
We’ve teamed up with Grafana Labs so you can use our platform as a data source for Prometheus metrics and see them in your existing dashboards, seamlessly tapping into the reliability, scale, and security provided by New Relic.
Follow the steps below or use this more detailed walkthrough to send Prometheus data to New Relic, so that Grafana can populate your existing Prometheus-specific dashboards with that data.
This process requires Prometheus version 2.15.0 or higher and Grafana version 6.7.0 or higher.
You’ll also need to sign up for New Relic.

Here's an example of how these Grafana dashboards with Prometheus data look in our new dark mode.
Step 1: Get data flowing into New Relic with the Prometheus remote write integration
Go to Instrument Everything – US or Instrument Everything – EU, then click the Prometheus tile.
You can also go to the Prometheus remote write setup page to get your remote_write URL.
For more information on how to set up the Prometheus remote write integration, check out our docs.
Step 2: Configure your Grafana dashboards to use Prometheus data stored in New Relic
For more information on how to configure New Relic as a Prometheus data source for Grafana, check out our docs.