One of the most important things you can do to maintain a high quality production environment is to make sure you have the web telemetry you need to detect and resolve poor user experience. This guide goes over making sure you're getting the data you need to optimize your . We'll help you ensure that you're:
- Getting the most value from the data you're collecting
- Seeing opportunities to optimize your service using your reported data
- Able to quickly triage and troubleshoot issues
- Getting the data you need to create real-time business KPI dashboards
Tune your browser application naming and sub-account placement
First, you'll need to ensure your browser naming and data organization are in place. If needed, you can change the name of your browser application following the renaming guide. If you have data from multiple environments reporting into one browser application, you can create new Browser apps and update the JavaScript snippet in your pages to report the right app.
Remember to keep the following in mind as you check your browser monitoring organization:
- Web application instrumentation from different environments (dev/qa/production) should report into different browser applications.
- Which environment a browser application supports (Such as Dev, QA, and production environments).
- The purpose of a browser application (customer facing, internal facing, website, website component, region or regions, etc).
Tune JavaScript errors
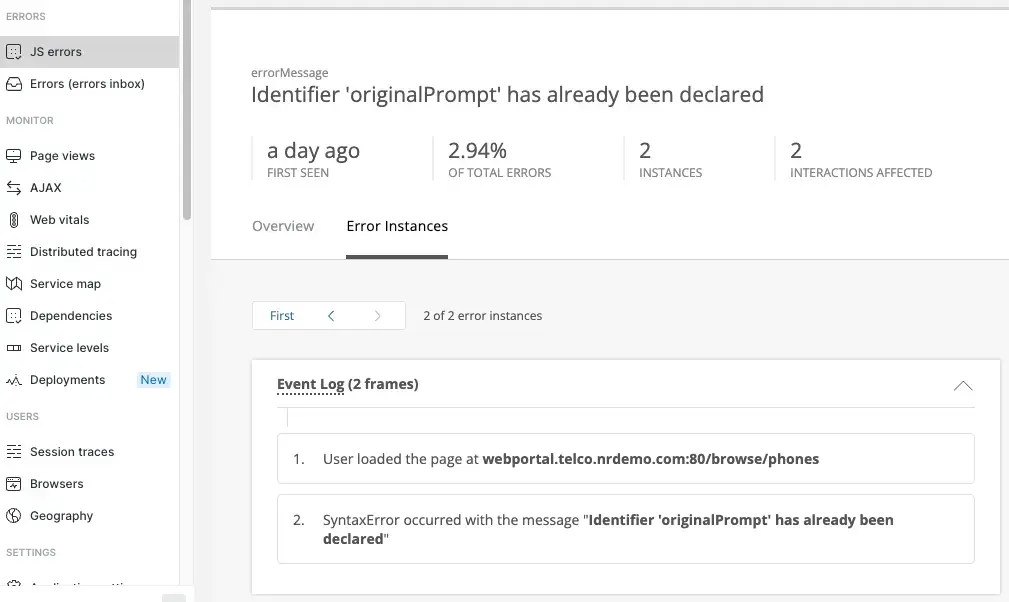
Next, you'll need to work with your JavaScript errors, which negatively impact user experience and SEO by disrupting the page load process, displaying errors, and preventing the user from completing an action. First, make sure JavaScript errors are being captured using the UI or NRQL.
Once you've ensured your JS errors are reporting, check that they also have event logs. The event log shows the browser interactions, AJAX calls, and traces that led up to a JS error. This can help you troubleshoot the root cause of errors.
Follow these instructions to troubleshoot missing event logs.
Finally, make sure your JavaScript errors have stack traces.
Follow these instructions to troubleshoot missing stack traces. Or, follow these instructions if you can see stack tracks but can't expand them.
Check page view grouping
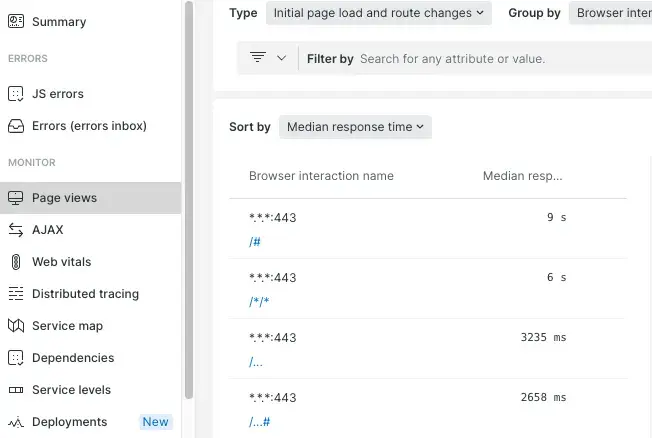
Next, check the page view grouping. Page URLs in the Page views UI are automatically grouped to help you manage page performance better. The algorithm that determines the automatic grouping runs when your web app is instrumented for the first time. If your web traffic today is much different from when the app was first instrumented, you may be seeing too few groups.
Use Segment allow lists to tune how your page view URLs are being grouped.
Check AJAX call grouping
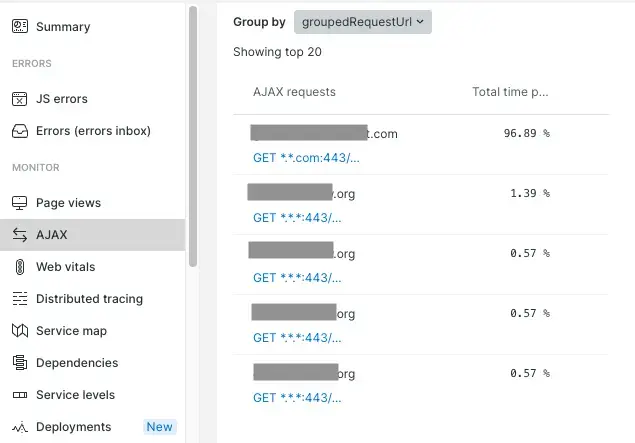
After you check your page views, you should do the same for your AJAX call grouping. AJAX calls are grouped to make it is easier to navigate them at scale. Sometimes there are so many AJAX calls that navigating them by individual request URL becomes difficult. Use the UI or a NRQL query to check if you need to adjust AJAX grouping.
Use Segment allow lists to tune how your AJAX Requests are being grouped.
Enable distributed tracing
Next, enable distributed tracing in Browser to help you improve AJAX performance by tracing requests to the backend all the way to the final endpoint. Tracing information is useful for understanding which applications are impacting user experience. You can use this information to address services issues yourself or delegate to the team responsible.
Set up deployments
Next, use NerdGraph to track changes in your web application so you can see the impact of changes you make against performance KPIs, conversions, and user engagement.
Add custom attributes
Use custom attributes to filter and group data. Though custom attributes are optional, you can get a lot of value from using them. Below are the most commonly recommended attributes, though you may find you want to add more:
Additional custom attributes for retailers
Realizing the value
Like the process of monitoring services, your observability program will benefit through a dedicated team function that thinks critically about its expectations of return for its investment in effort. The following section outlines an approach for estimating the costs and benefits you should expect by incorporating web instrumentation into your observability practice.


