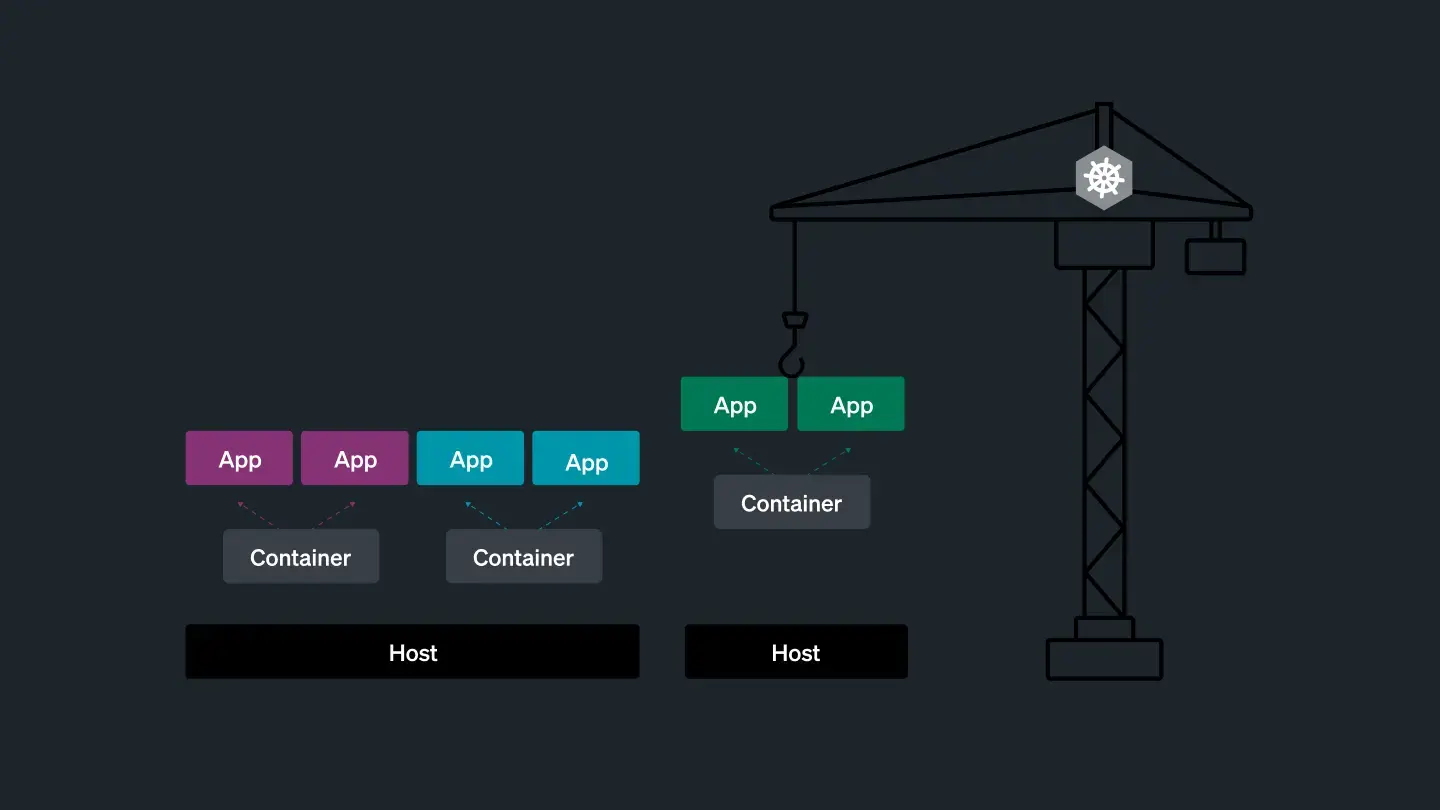
Let's review what makes up a Kubernetes system and explore how New Relic can help you understand your system at a cluster-wide level.
Break it apart to understand
Let's break a Kubernetes system into distinct layers first.

We'll discuss a Kubernetes system in three key sections.
The cluster: this represents the entire Kubernetes system. The cluster contains multiple deployments, which in turn house many pods. Each pod maintians its individual services and applications.
The orchestrated: these are the core elements of a Kubernetes system. Orchestrated components consist of entire deployments that spin pods up and down as needed.
The services and applications: services and applications are the workhorses of the Kubernetes system. Within a Kubernetes system each pod houses one or more services and applications. The services and applications provide the essential functionality that drives the purpose of system. This could be computation, a web app, or any other application.
It's important to note that these sections nest within each other. The cluster contains multiple orchestrated layers, and each orchestrated layer consists of multiple service and application layers.
중요
There are many ways you can split up a Kubernetes system to understand it; these layers are just one way to think about your system.
Understand and monitor the cluster layer
In a large Kubernetes system, with numerous deployments and pods, manually monitoring each component becomes impractical. You might be dealing with dozens or hundred of deployments, which in turn means you might have to monitor hundreds or thousands of individual pods, services, and applications. New Relic offers a more efficient approach to oversee the entire system's health and receive timely when issues arise.
The following steps guide your through a general monitoring strategy for your cluster:
Go to the Kubernetes overview dashboard
Go to one.newrelic.com > All capabilities > Kubernetes > Overview Dashboard. Be sure to scroll down to see all the graphs available to you.
If you don't see any data, make sure you set up your monitoring in the previous tutorial.
Triage your cluster
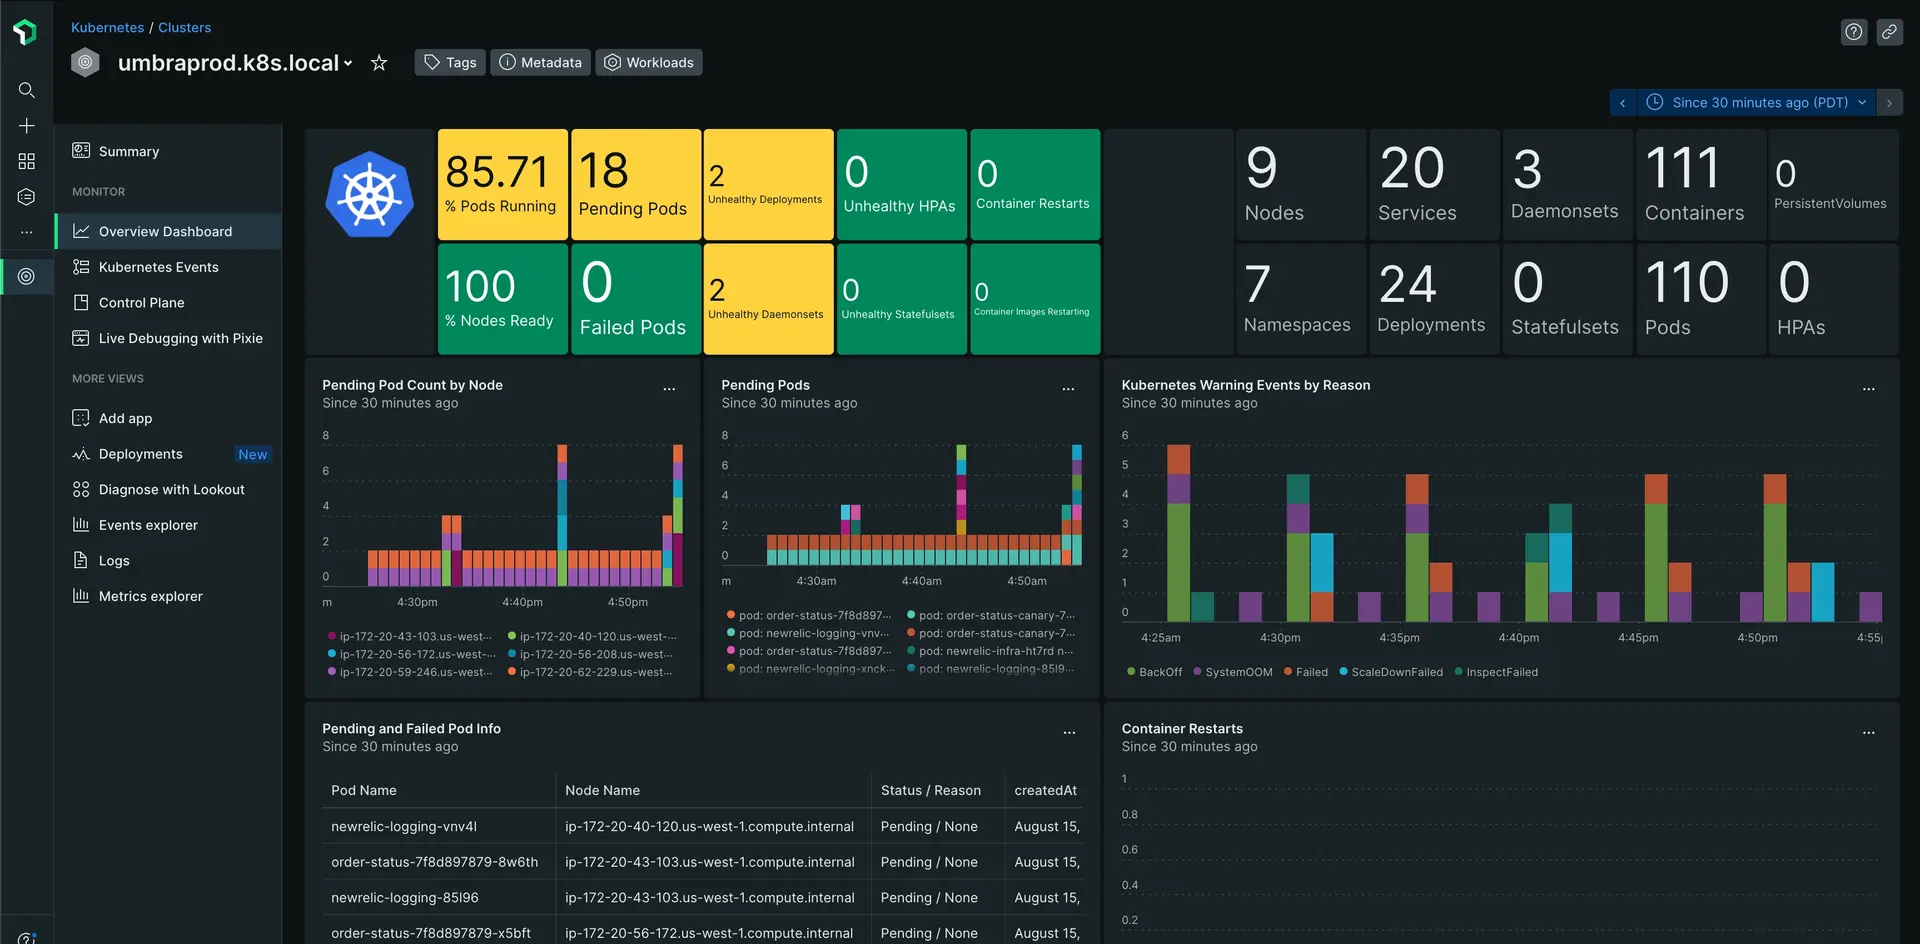
The Kubernetes overview dashboard shows your high level data about your cluster. You can find general data such as the count of pods and services. More importantly you can find data about the health of your cluster such as the percentage of pods running, the count of failed pods, the number of container restarts, and more.

Use this dashboard to gauge the general health of your cluster. Here are a few things to look for:
Component | What it indicates |
|---|---|
Red or yellow tiles | Yellow tiles are warnings. Keep an eye on what they refer to. For example, if you have 2 unhealthy deployments you should take note and plan to troubleshoot those deployments. Red tiles are critical alerts. These aren't necessarily failures in your system, but you should prioritize addressing them as immediately as possible. |
Anomalous spikes in graphs | there are various graphs that show things such as pending pods over time or memory utilization over time. Spike are not always cause for concern, such as the spikes in the Kubernetes Warning Events by Reason graph in the screenshot above. These spikes happen regularly about every 5 minutes so they don't raise any red flags. Look for spikes that happen outside of regular patterns or spikes in a much larger magnitude than normal. |
Node readiness | Observe whether nodes in the cluster are ready and able to host pods. Ensure that your cluster's infrastructure can handle workloads without any bottlenecks. |
Resource count insights | Keep a close eye on the number of pods, containers, nodes, or other Kubernetes resources within the cluster. While you won't always find something actionable, monitoring resource utilization allows you to plan for future scaling. |
Use the time selector in the top left of the page to see your data across time ranges to verify any troubling data isn't just random or to triage across a longer timeframe.