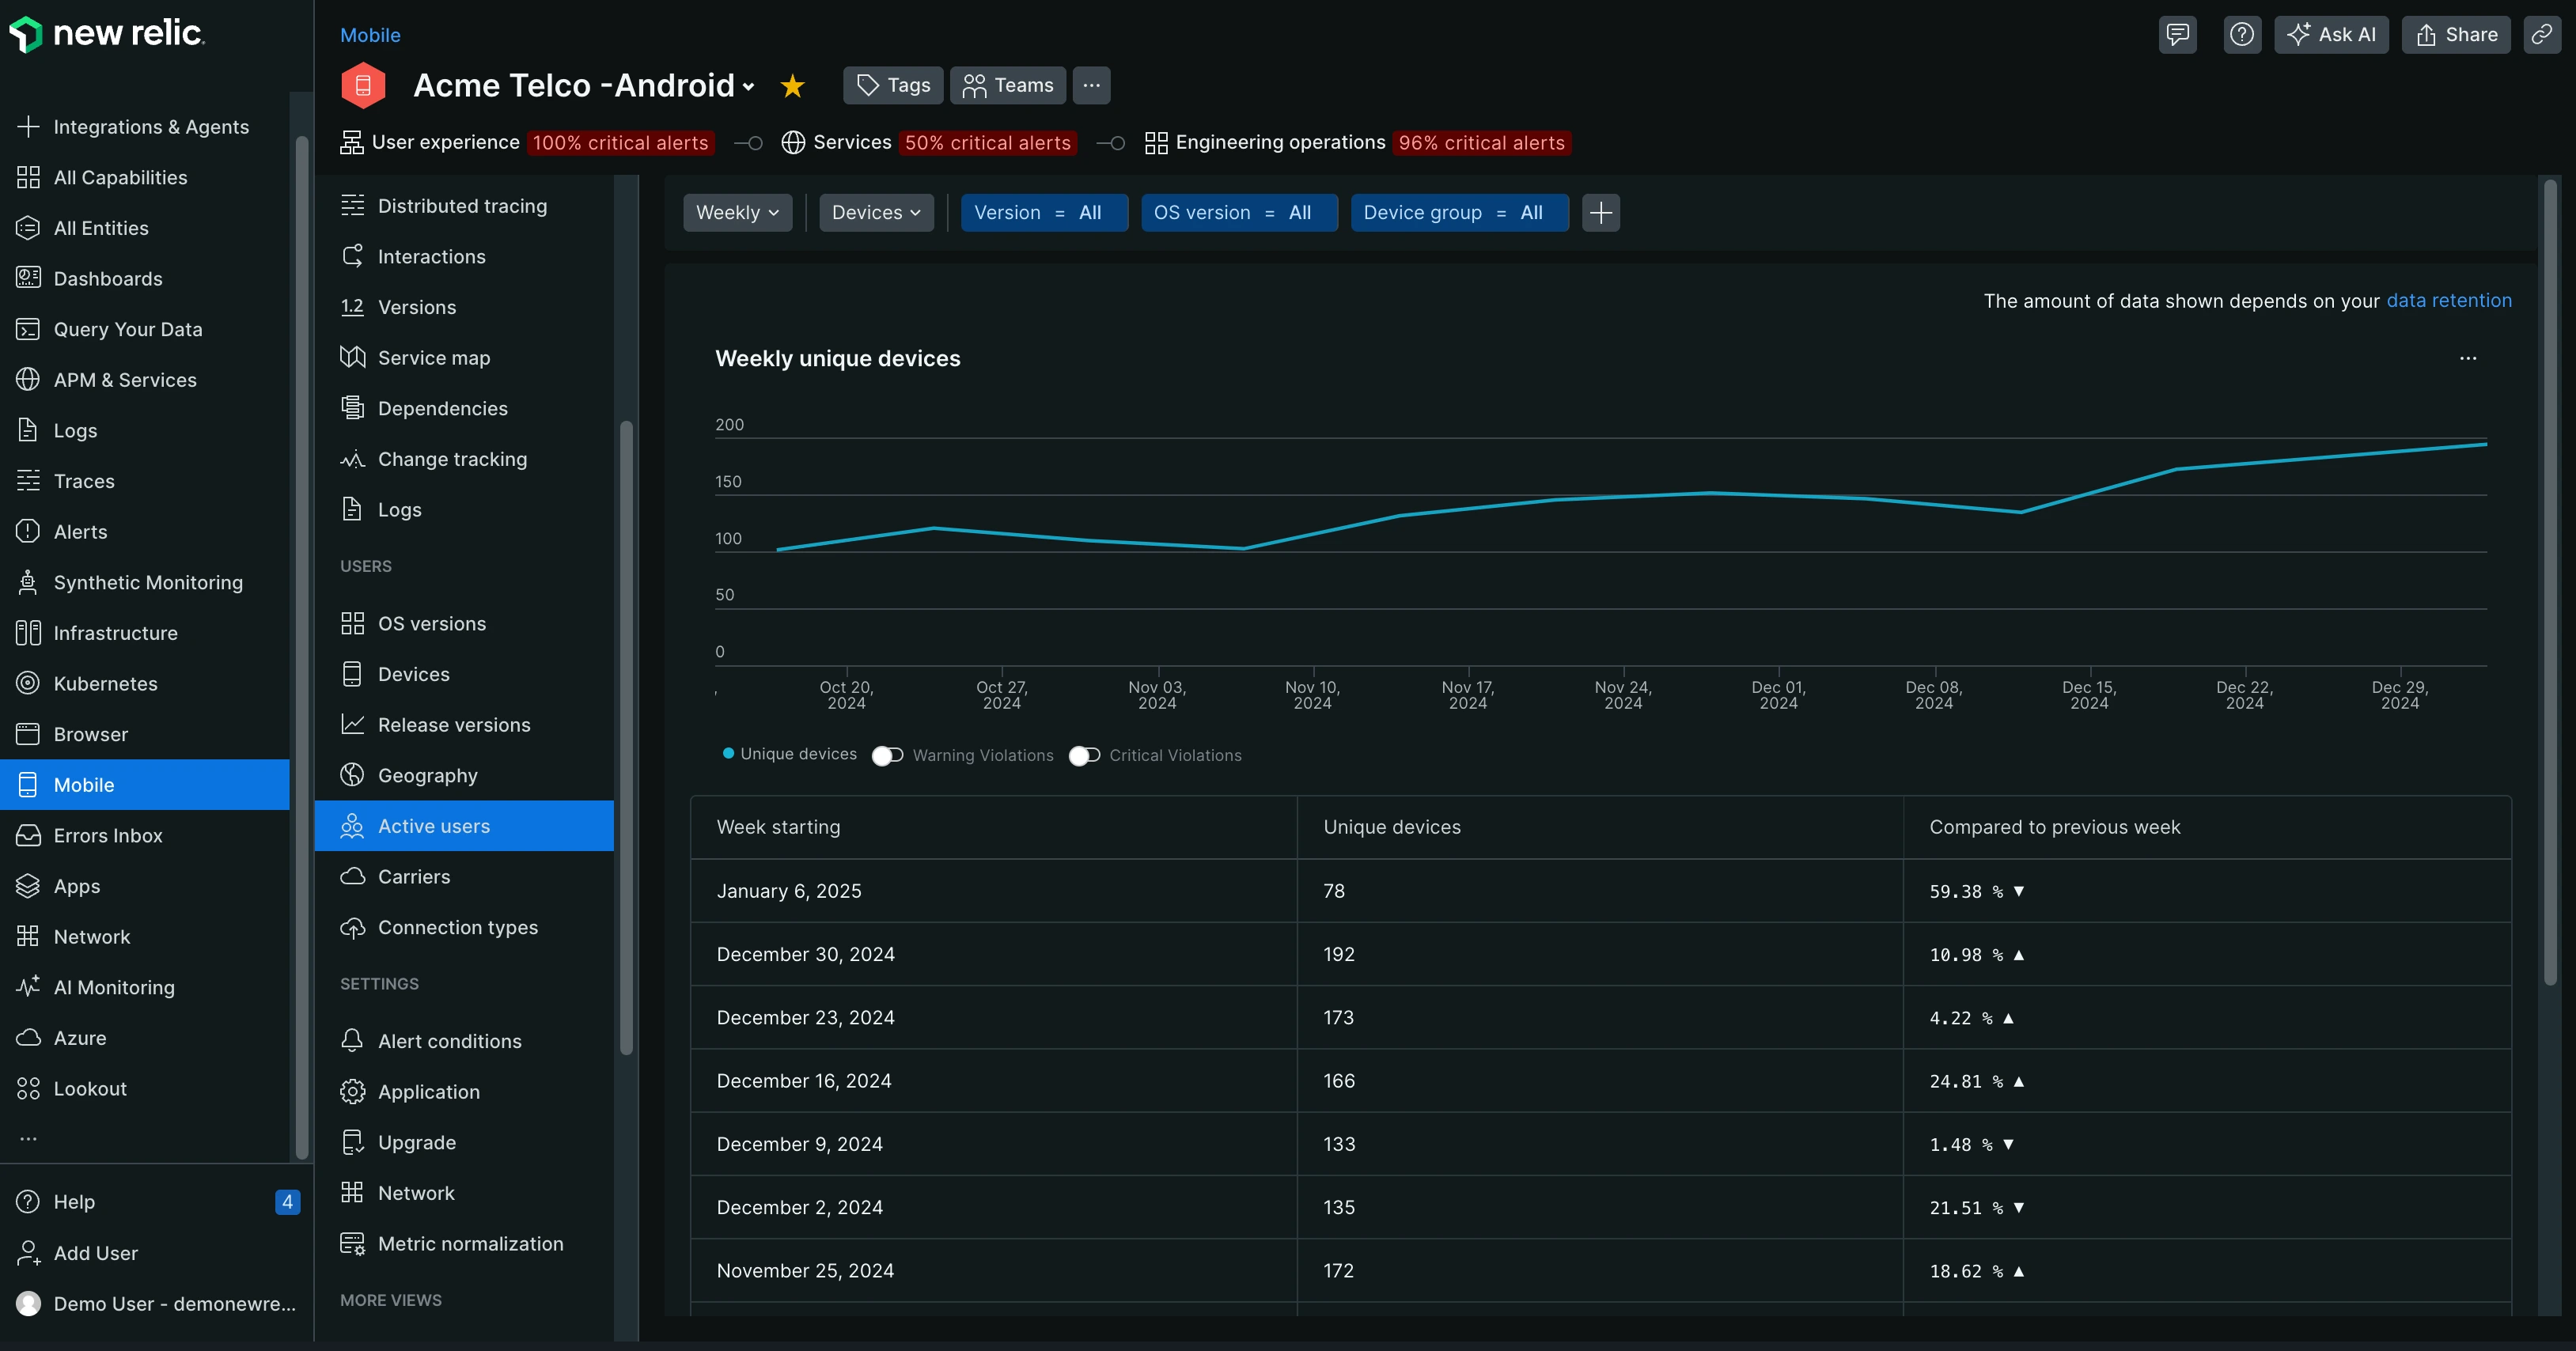
The capability includes a report tracking the number of devices, sessions or users running your app for each day, week, or month trended over time. To view the report: Go to one.newrelic.com > All capabilities > Mobile > (select an app) > Usage > Active users.
Active users details
By default, the charts and tables will display monthly unique devices. Use the dropdowns in the filter bar to change the time window to weekly or daily or to change the metric to sessions or users. Additionally, you can use the version, OS version, device group, or custom filters for further segmentation.
To see the total number of devices, sessions or users for any time period, mouse over the line in the line chart. The current time period's value is a month-to-date, week-to-date or day-to-date value and does not indicate the full month, week, or day's usage.
The active users table displays the chosen time period, as specificed by the filter selected, the unique metric and a comparison to the previous time period. For example, if Monthly is selected, the table will show the last 12 months, the unique data for those months, and a percent increase or decrease from the previous month.

one.newrelic.com > All capabilities > Mobile > (select an app) > Usage > Active users: This report provides a line chart and table tracking the number of devices, sessions or users running your app for each month, week or day over the last year.
To drill down into detailed information, click on a row of the table. This will open a stacked view with a detailed line chart for that time period.
Device tracking
Mobile monitoring does not use hardware identifiers for unique install tracking.
- On iOS we use the IdentifierForVendor property. (Versions 5.3.4 and lower used the SecureUDID library.)
- On Android we generate a unique GUID when the application is installed.