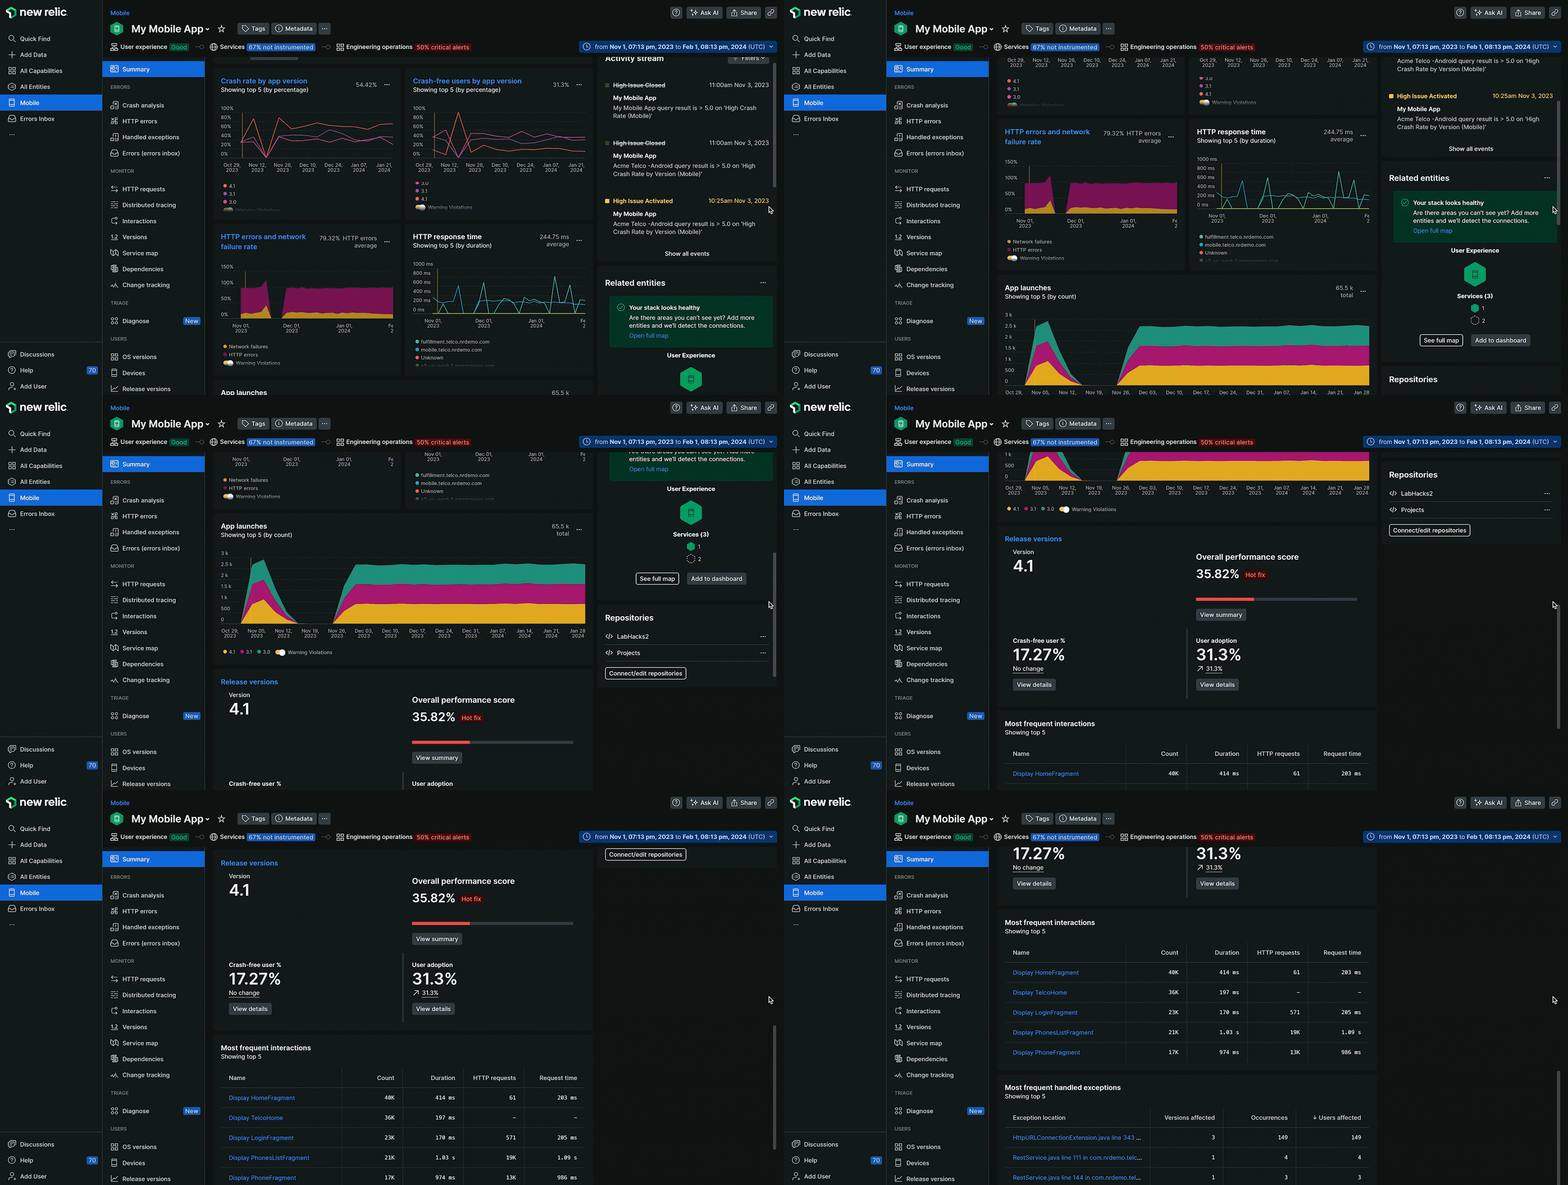
The Summary page provides an operational snapshot of your mobile app. All charts, tables, and statistics show data for a specified time window and app version.

one.newrelic.com > All capabilities > Mobile > (select an app): The summary page provides high-level performance data and a landing base to drill down into specific metrics or issues.
The Summary page captures five key performance metrics:
Metric | Description |
|---|---|
Application crash rate | Number of crashed sessions over time as a percentage of all sessions, broken out by app version. The average crashed session percent, total number of crashes, and count of unique users affected by those crashes during the time window is shown in the upper right. |
App launches | Number of app session launches monitored over the time window. An app launch is defined by the length of time between the app loading on a screen and when the app is sent to the background. |
HTTP errors (network failures) | Number of network requests that result in a |
HTTP response time | Average response time of all completed http requests from each of the top five hosts your app communicates with. The top five hosts are calculated based on count of completed requests to each host. |
Frequent interactions | Five most commonly executed user interactions in your app. |
View the Summary page
- Go to one.newrelic.com > All capabilities > Mobile.
- Select your mobile app. The Summary page loads by default.
Dive deep into specific performance metrics
If you want to... | Do this |
|---|---|
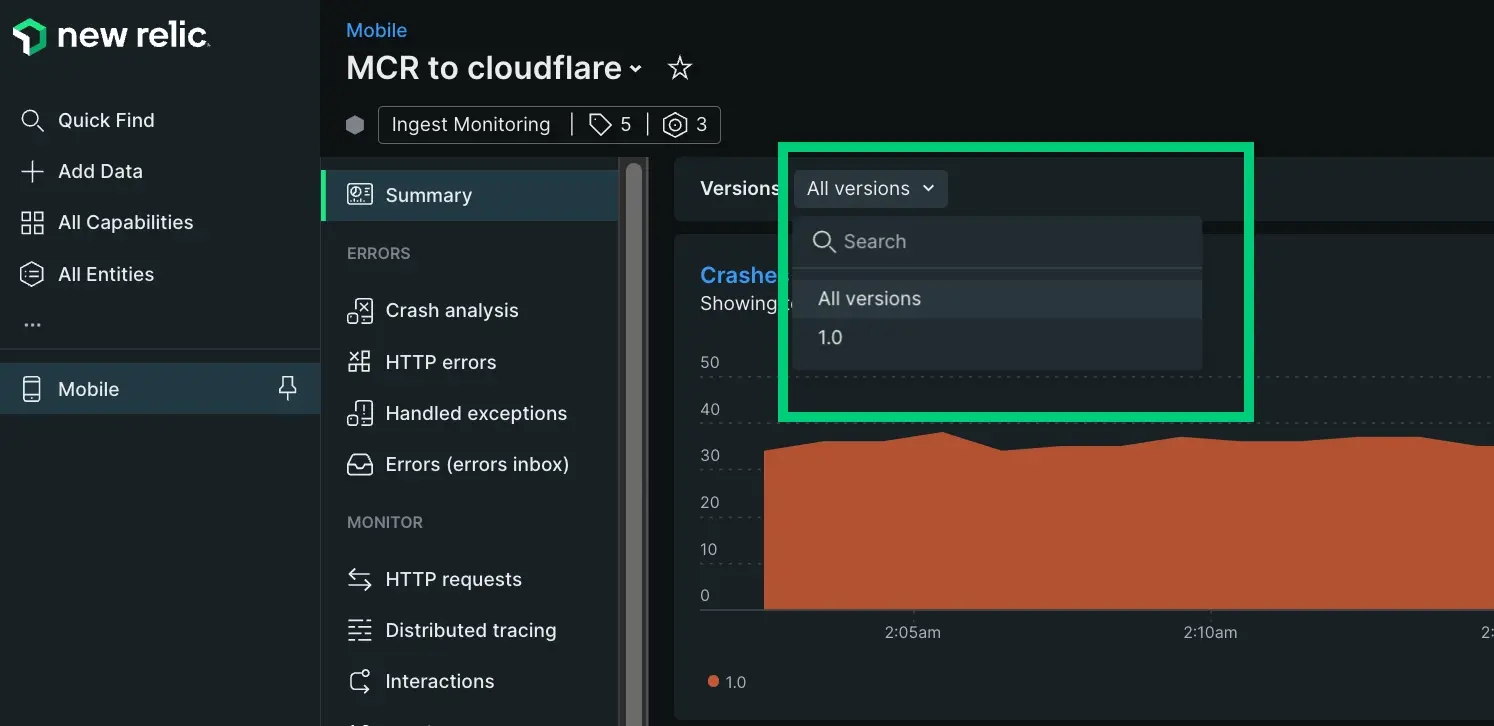
Filter metrics by a specific app version | Select your choice from the Versions menu below the New Relic menu bar (if multiple versions are available).  |
View additional details about interactions | Select the Most frequent interactions table and click into a specific interaction. |
View additional details about mobile app crashes | Select the Crash rate chart's title to go to the Crash list page. |
View additional details about mobile versions | Select the App launches chart's title to go to the Versions page. |
View additional details about HTTP response time | Select a point anywhere in the HTTP response time chart to go to the HTTP requests page. |
View additional details about HTTP errors or network failures | Select the HTTP errors/network failure chart's title, OR click anywhere in the table to go to the Errors page. |
(Recommended) Set up mobile monitoring alerts
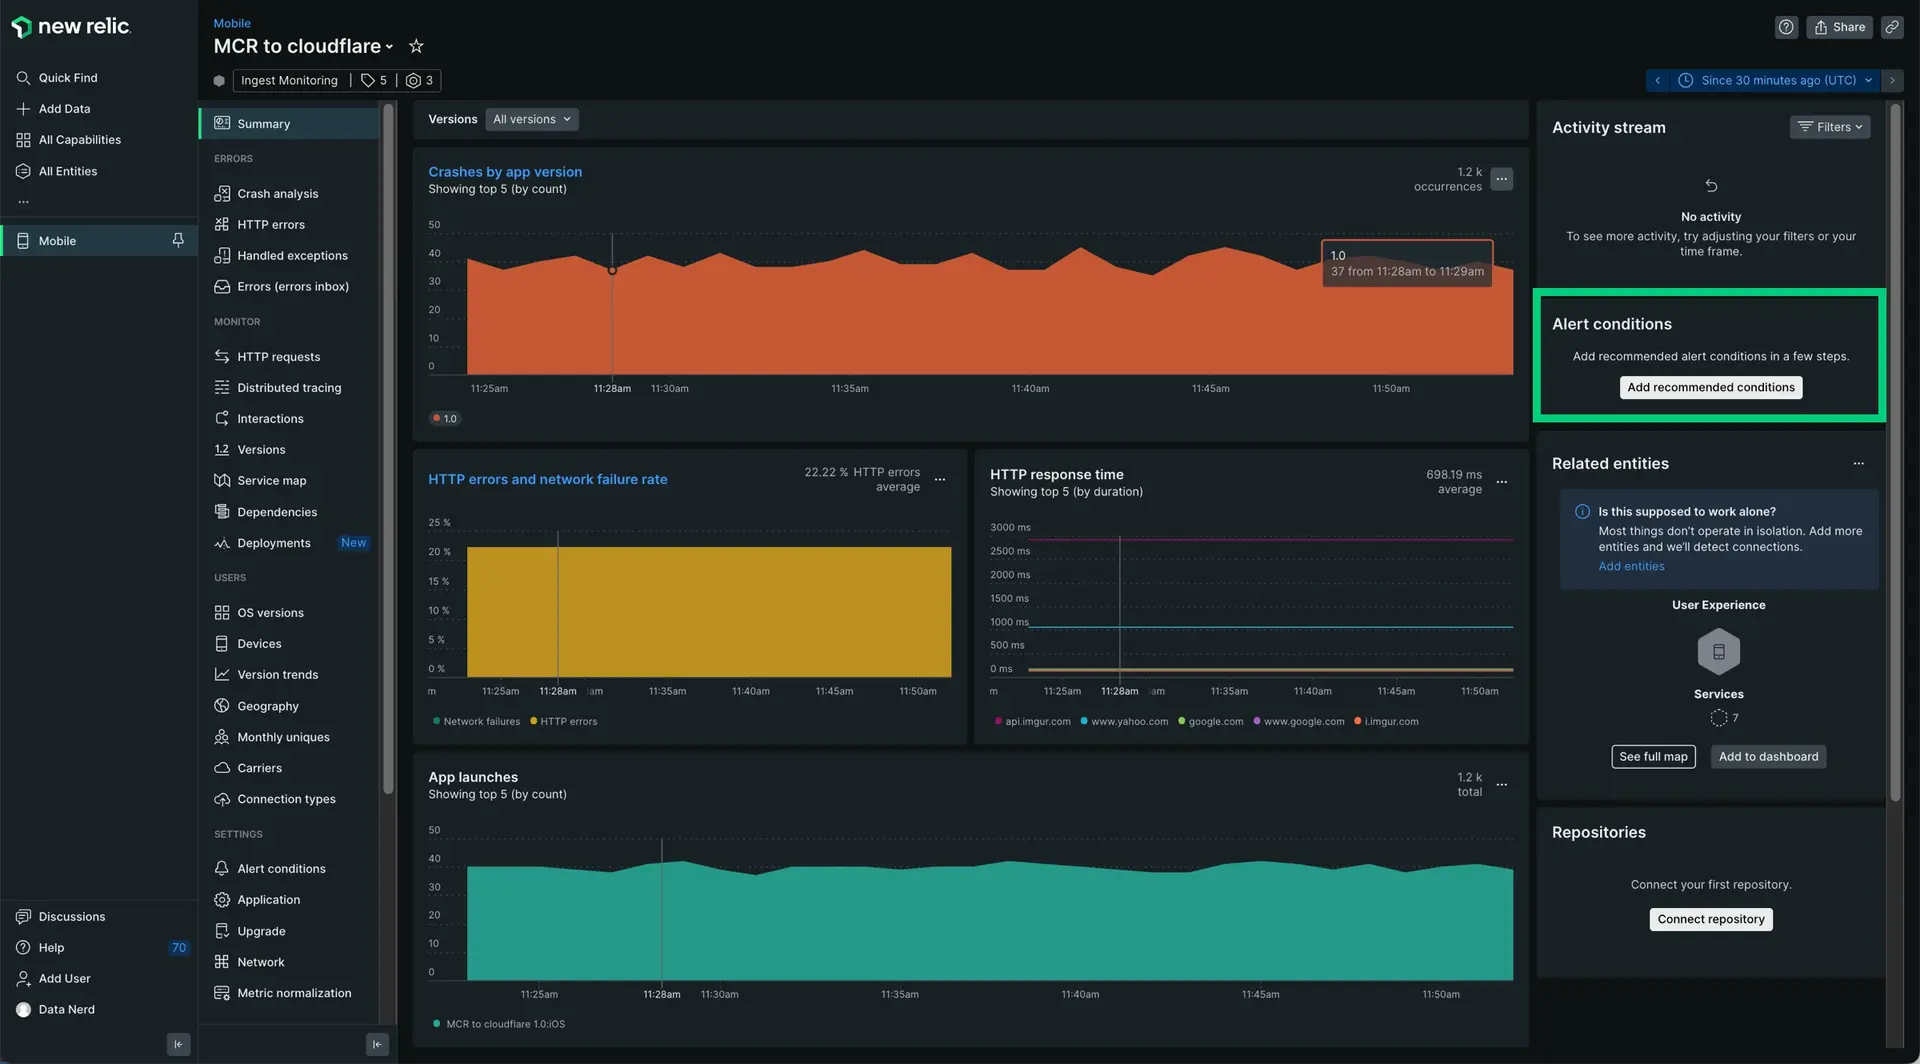
We recommend creating alerts for key mobile issues like slow network requests and increases in crash rate. To easily set up these alerts from the Summary page:
Click Add recommended conditions.

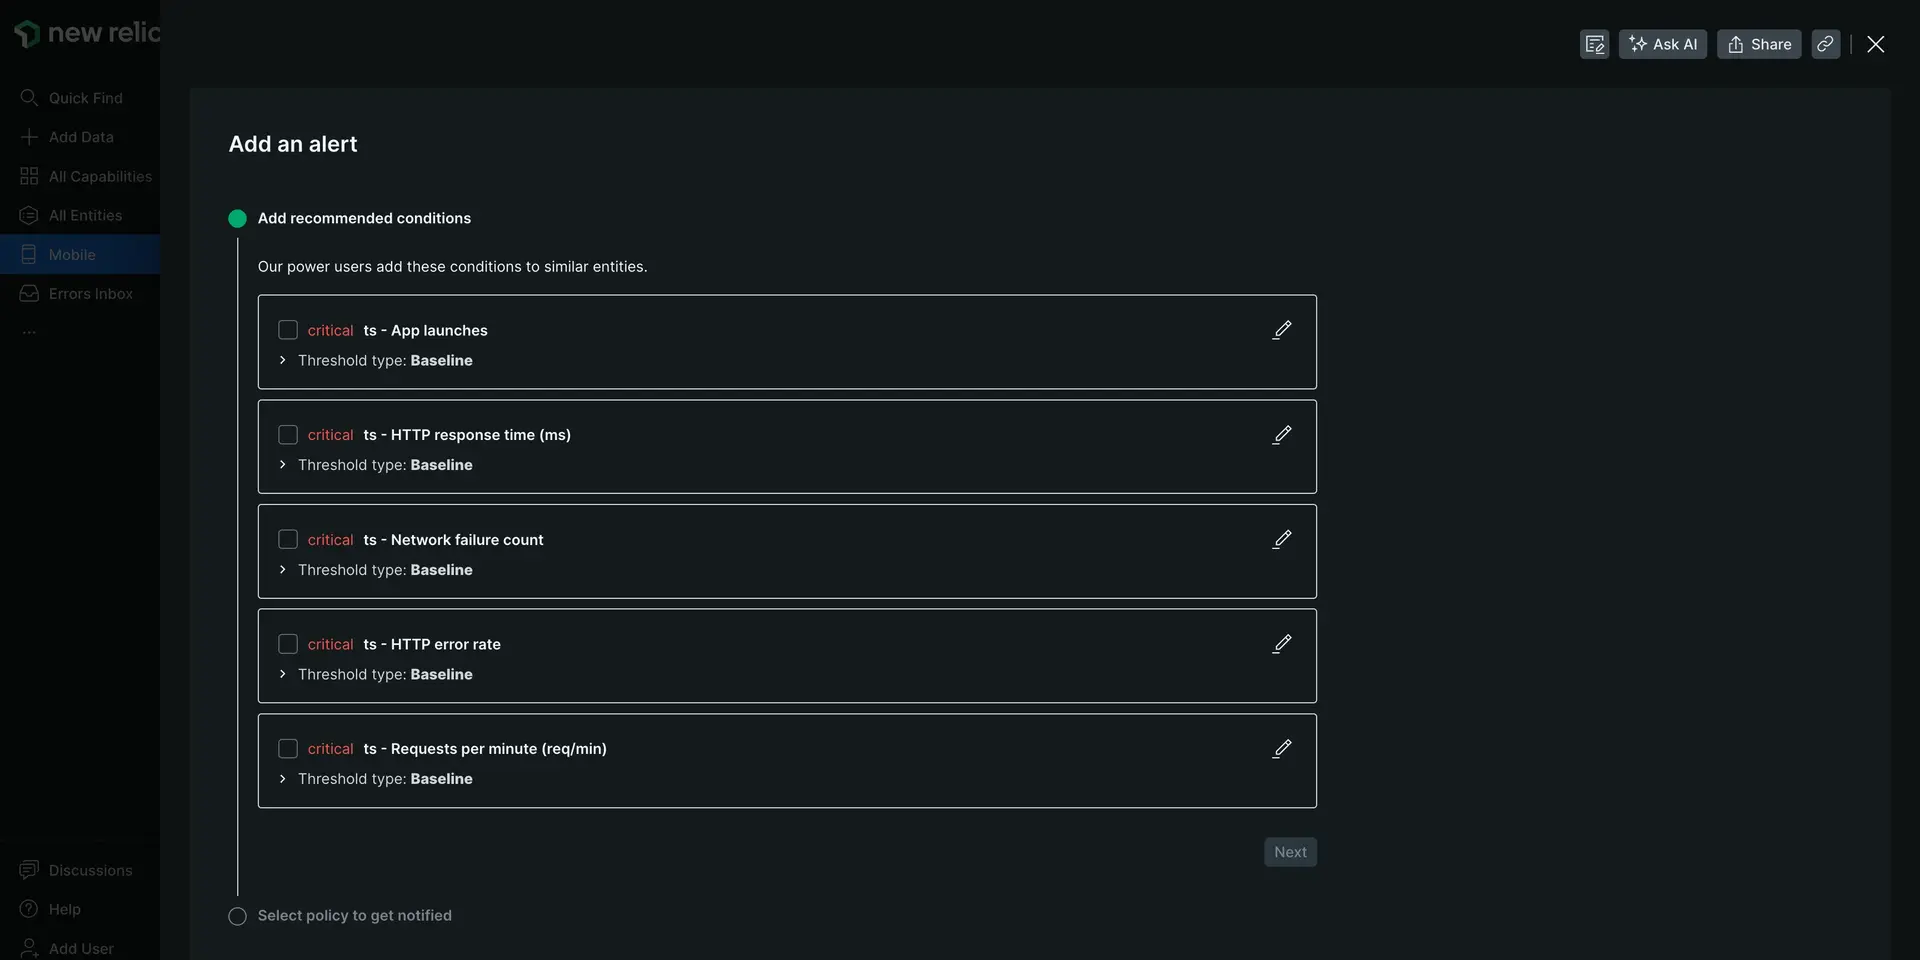
Choose a number of recommended alert conditions.

Click Next.
Select a policy to get notified. You can select an existing one or create a new policy.
Click Activate conditions.