To generate verbose logs and get version and configuration information, follow the steps below. For troubleshooting help, see Not seeing data or Error messages.
If you're using version 2 of the integration, see Kubernetes logs in version 2.
The Kubernetes integration does not produce debug level logs. If you are doing a more in-depth investigation on your own or with New Relic Support, you can enable verbose mode.
주의
Verbose mode significantly increases the amount of info sent to log files. Only enable this mode temporarily for troubleshooting purposes, and reset the log level when finished.
To get verbose logging details using Helm and the
nri-bundlechart:Add the following configuration to your
values.yamlfile.# To enable verboseLog for newrelic-infrastructure onlynewrelic-infrastructure:verboseLog: trueYou can also enable verbose logging for all subcharts:
# To enable verboseLog for all sub-chartsglobal:verboseLog: trueOnce you have added the desired configuration, upgrade the solution with this command:
bash$helm upgrade RELEASE_NAME newrelic/nri-bundle \>--namespace NEWRELIC_NAMESPACE \>-f values-newrelic.yaml \>[--version fixed-chart-version]After collecting your verbose logs, revert the change in your
values.yamlfile, and run theupgradecommand again.
To get verbose logging details using a manifest file:
You need to set two different environment variables:
NRIA_VERBOSE="1"for allagentandforwardercontainers; this enables agent verbose logs. You can set this belowNRIA_LICENSE_KEY.Set
NRI_KUBERNETES_VERBOSE=true"in all components of the integration; this enables verbose logs for the integration.env:- name: NRIA_LICENSE_KEYvalueFrom:secretKeyRef:key: licenseKeyname: newrelic-bundle-newrelic-infrastructure-license- name: NRIA_VERBOSEvalue: "1"
Once you have edited the manifest, upgrade the solution with this command:
bash$kubectl apply -f your_newrelic_k8s.yaml -n NEWRELIC_NAMESPACEAfter collecting your verbose logs, revert the change in the manifest, and apply the manifest again.
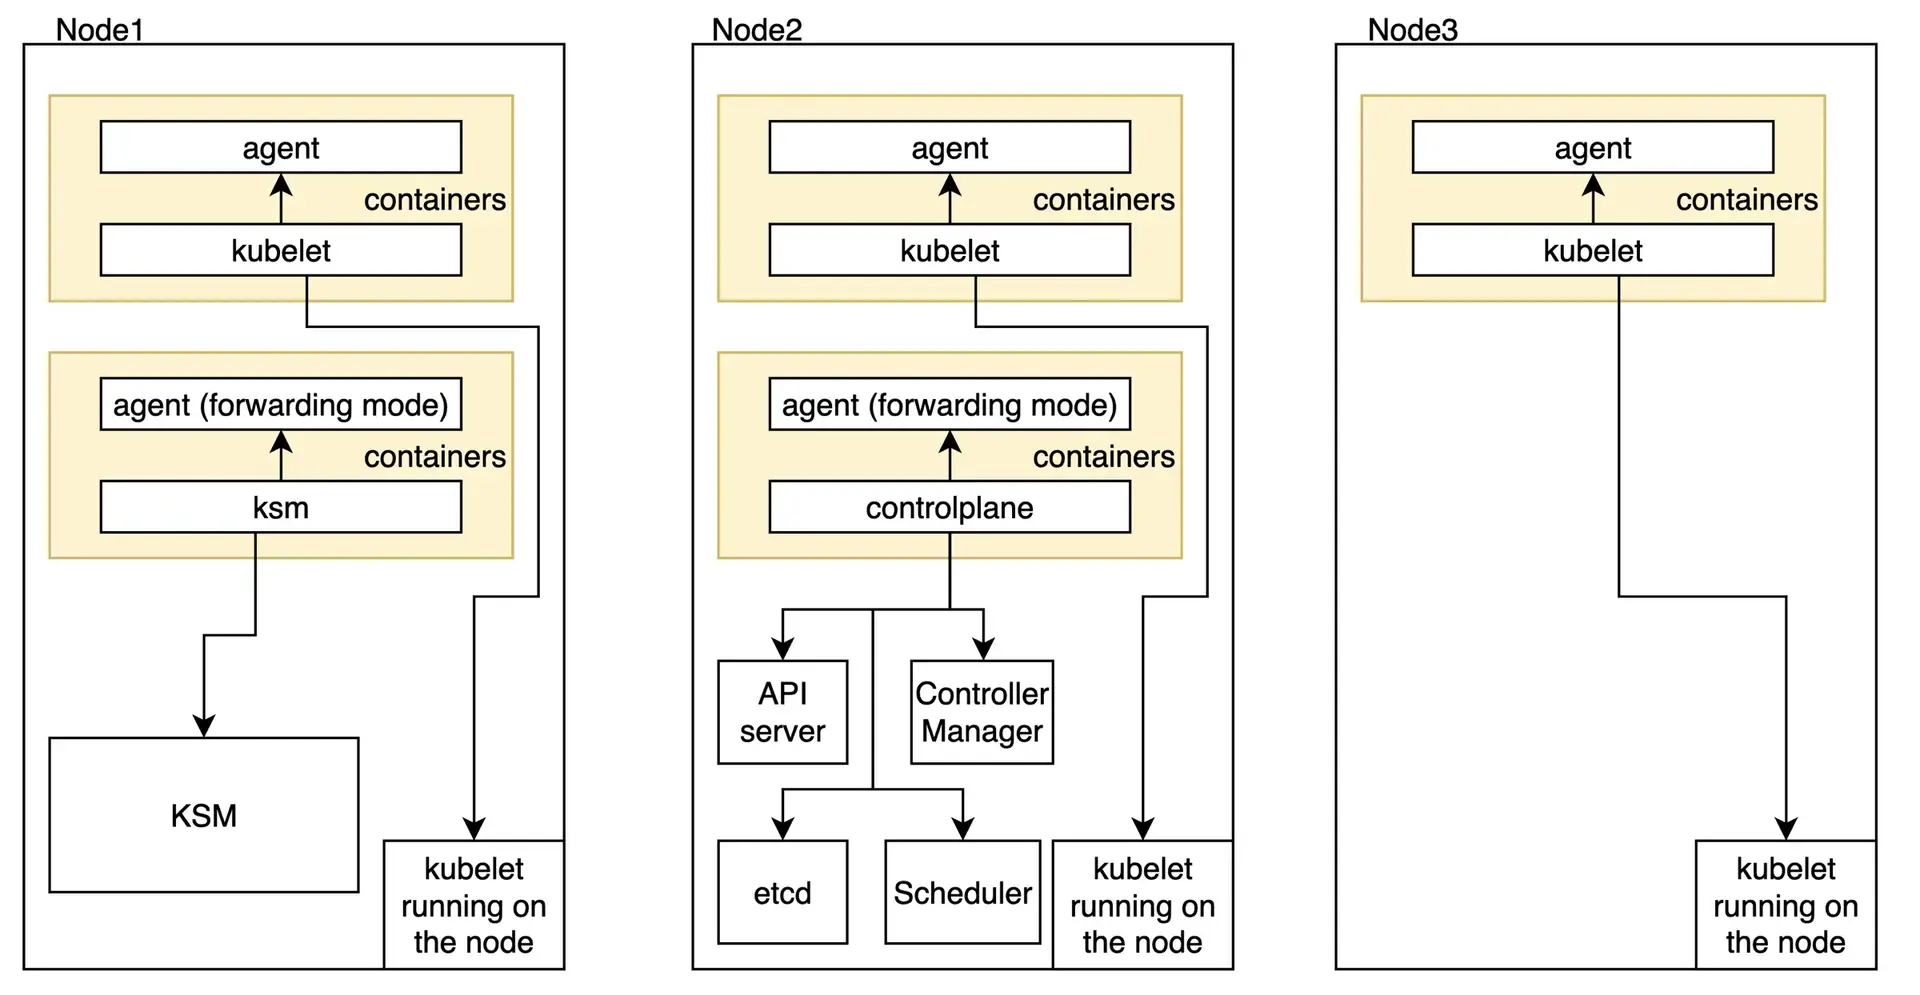
There are three different components of the integration that are in charge of scraping ksm, controlplane, and kubelet.
In each instance, there are two containers running, with one scraping the data and the other one forwarding it.
The agent in the kubelet component is also in charge of scraping node data and running integrations. The diagram below shows the integration installed in a cluster with three nodes.

To fetch logs, get the name of the pods you want to retrieve logs from:
$kubectl get pods -n NEWRELIC_NAMESPACERetrieve the logs:
$kubectl logs POD_NAME --all-containers --prefixTo retrieve logs from the previous execution, add the --previous flag. To get logs from only one of the containers, remove the --all-containers --prefix flag and specify the container with the --container option.
중요
For the best experience with our Kubernetes integration, we recommend that you use the latest version. Check out the changes introduced in version 3.
When you use the Kubernetes integration, the infrastructure agent is distributed as a Docker image that contains both the infrastructure agent and the Kubernetes integration. The Docker image is tagged with a version, and the infrastructure agent also has its own version.
Once the agent is sending data to New Relic, you can retrieve the versions of the infrastructure agent for Kubernetes (the Docker image) you are running in your clusters by using the following NRQL query:
FROM K8sContainerSampleSELECT uniqueCount(entityId)WHERE containerName LIKE '%agent%'FACET clusterName, containerImageIf the agent isn't reporting any data:
Get the versions of the New Relic integration for Kubernetes that you are running in a cluster using kubectl:
$kubectl get pods --all-namespaces -l app.kubernetes.io/name=newrelic-infrastructure \> -o jsonpath="{.items..spec..containers..image}"To retrieve the version of kube-state-metrics running on your clusters, run the following NRQL query:
FROM K8sContainerSampleSELECT uniqueCount(entityId)WHERE containerName LIKE '%kube-state-metrics%' FACET clusterName, containerImageTo check the logs of our event collector, run this command:
$kubectl logs deploy/nr-kube-events kube-eventsTo add more details, enable verbose mode by adding verbose: "true" in the config section of you configuration file, either before or after the clusterName.
To check the logs of the agent responsible for sending the events to New Relic, run this command:
$kubectl logs deploy/nr-kube-events infra-agent