Here are some technical details about how New Relic distributed tracing works:
- How trace sampling works
- How we structure trace data
- How we store trace data
- How trace context is passed between applications
Trace sampling
How your traces are sampled will depend on your setup and the New Relic tracing tool you're using. For example, you may be using a third-party telemetry service (like OpenTelemetry) to implement sampling of traces before your data gets to us. Or, if you're using Infinite Tracing, you'd probably send us all your trace data and rely on our sampling.
We have a few sampling strategies available:
- Head-based sampling (standard distributed tracing)
- Tail-based sampling (Infinite Tracing)
- No sampling
Head-based sampling (standard distributed tracing)
With the exception of our Infinite Tracing feature, most of our tracing tools use a head-based sampling approach. This applies filters to individual spans before all spans in a trace arrive, which means decisions about whether to accept spans are made at the beginning (the "head") of the filtering process. This sampling strategy can be helpful for capturing a representative sample of activity while avoiding storage and performance issues.
Once the first span in a trace arrives, a session is opened and maintained for 90 seconds. With each subsequent arrival of a new span for that trace, the expiration time is reset to 90 seconds. Traces that have not received a span within the last 90 seconds will automatically close. The trace summary and span data are only written when a trace is closed.
Here are some details about how head-based sampling is implemented in our standard distributed tracing tools:
Tail-based sampling (Infinite Tracing)
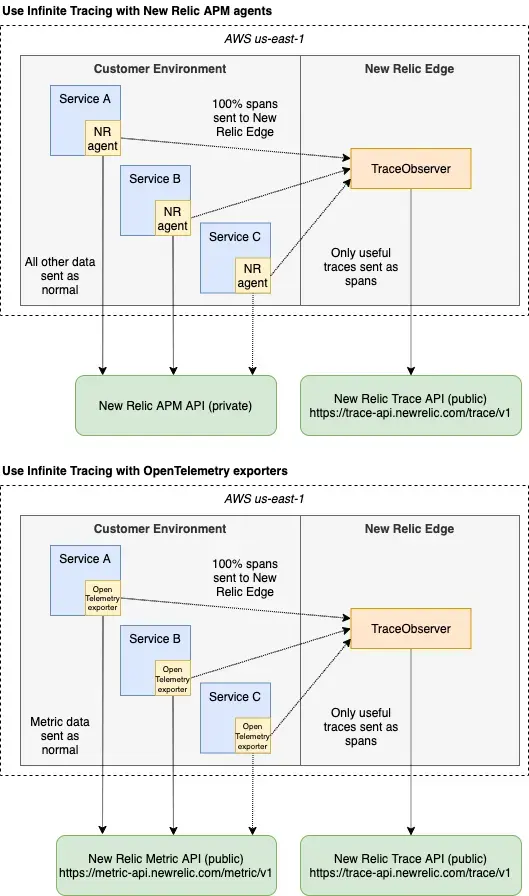
Our Infinite Tracing feature uses a tail-based sampling approach. "Tail-based sampling" means that trace-retention decisions are done at the tail end of processing after all the spans in a trace have arrived.
With Infinite Tracing, you can send us 100% of your trace data from your application or third-party telemetry service, and Infinite Tracing will figure out which trace data is most important. And you can configure the sampling to ensure the traces important to you are retained.
중요
Because Infinite Tracing can collect and forward more trace data from your application or third-party telemetry service, you may find your egress costs increase as a result. We recommend that you keep an eye on those costs as you roll out Infinite Tracing to ensure this solution is right for you.
No sampling
Some of our tools don't use sampling. Sampling details for these tools:
Trace limits
Our data processing systems include internal limits to protect our infrastructure from unexpected data surges: Trace API, agent spans, browser spans, mobile spans, and lambda spans. This protective layer not only maintains the integrity of our platform but also ensures a dependable and consistent experience for all our customers. We adjust these limits as needed based on various conditions, but they're set with a forward-looking approach. As our users and data grow, we expand our infrastructure capacity and raise these limits. This commitment ensures that we capture all customer data sent our way and offer you a clear and uninterrupted view into your trace data. To check if you are hitting these limits, you can refer to the Limits UI.
How trace data is structured
Understanding the structure of a distributed trace can help you:
- Understand how traces are displayed in our UI
- Help you query trace data
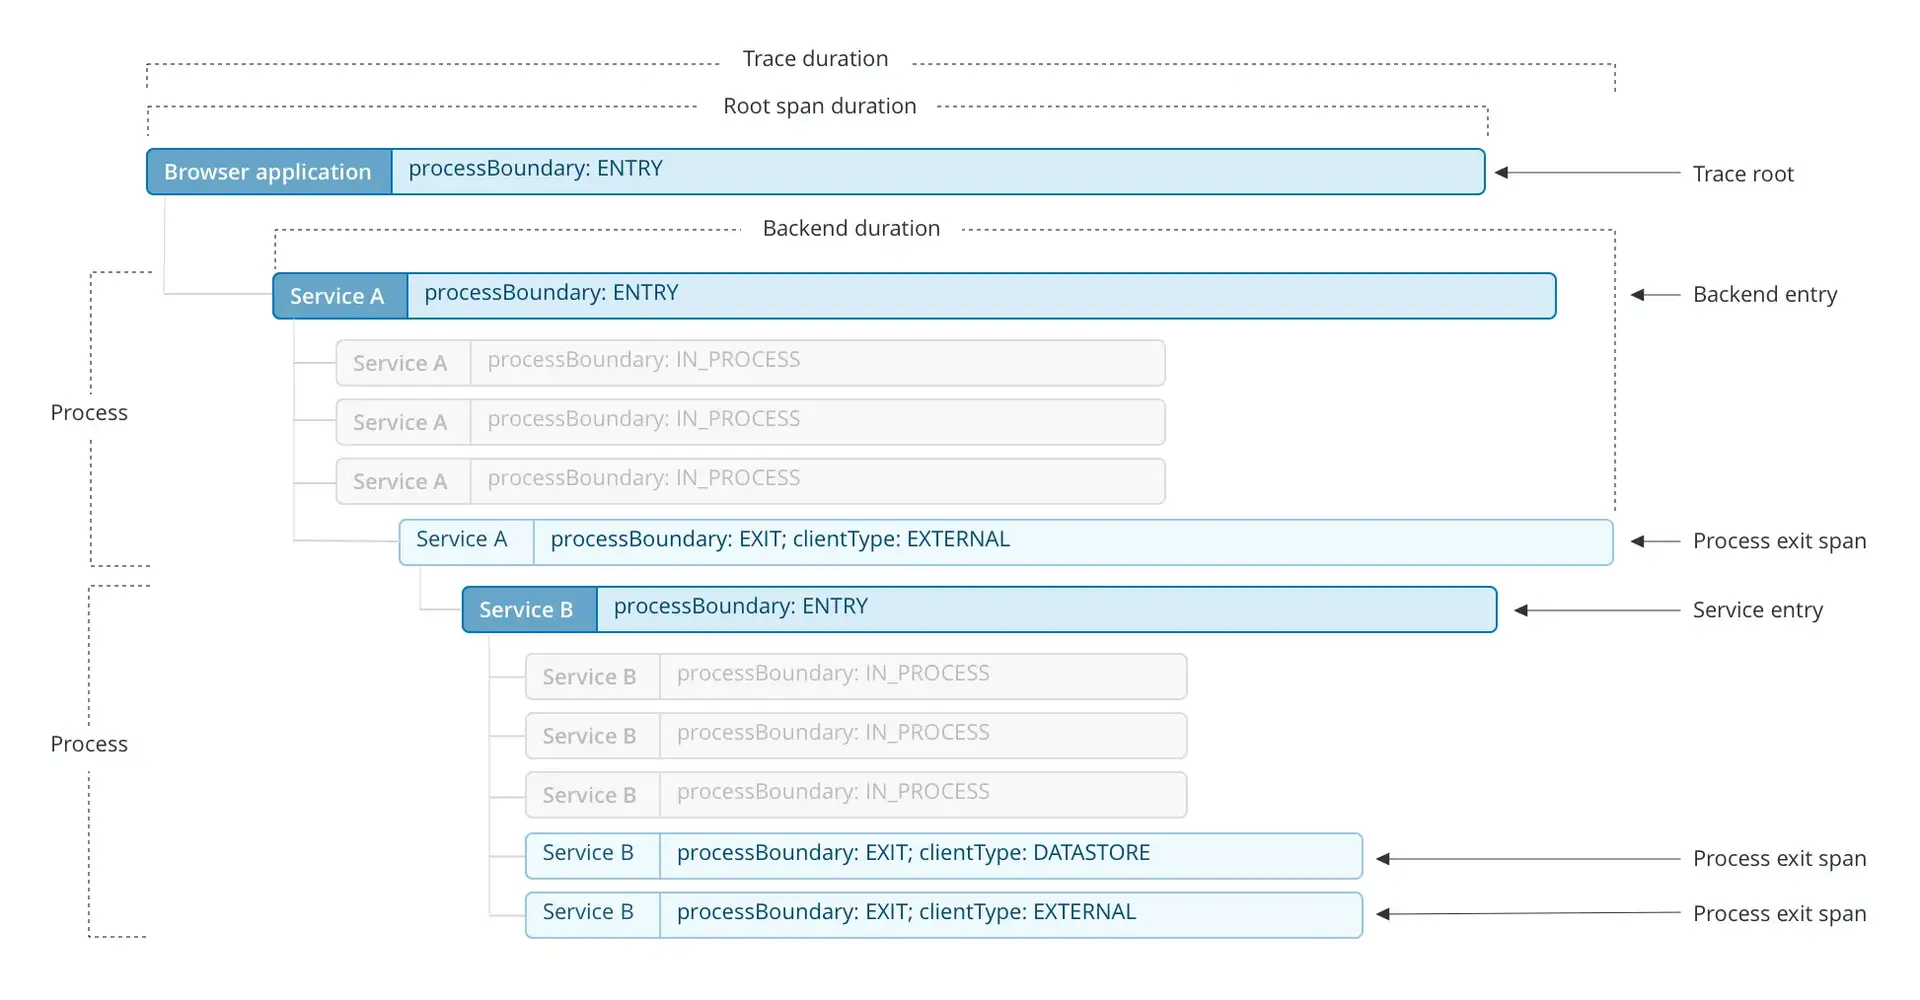
A distributed trace has a tree-like structure, with "child" spans that refer to one "parent" span. This diagram shows some important span relationships in a trace:

This diagram shows how spans in a distributed trace relate to each other.
This diagram shows several important concepts:
- Trace root. The first service or process in a trace is referred to as the root service or process.
- Process boundaries. A process represents the execution of a logical piece of code. Examples of a process include a backend service or Lambda function. Spans within a process are categorized as one of the following:
- Entry span: the first span in a process.
- Exit span: a span is a considered an exit span if it a) is the parent of an entry span, or b) has
http.ordb.attributes and therefore represents an external call. - In-process span: a span that represents an internal method call or function and that is not an exit or entry span.
- Client spans. A client span represents a call to another entity or external dependency. Currently, there are two client span types:
- Datastore. If a client span has attributes prefixed with
db.(likedb.statement), it's categorized as a datastore span. - External. If a client span has attributes prefixed with
http.(likehttp.url) or has a child span in another process, it's categorized as an external span. This is a general category for any external calls that aren't datastore queries. If an external span containshttp.urlornet.peer.name, it's indexed on the External services page.
- Datastore. If a client span has attributes prefixed with
- Trace duration. A trace's total duration is determined by the length of time from the start of the earliest span to the completion of the last span.
You can query span relationship data with the NerdGraph GraphiQL explorer at api.newrelic.com/graphiql.
How trace data is stored
Understanding how we store trace data can help you query your trace data.
We save trace data as:
Span: A span represents operations that are part of a distributed trace. The operations that a span can represent include browser-side interactions, datastore queries, calls to other services, method-level timing, and Lambda functions. One example: in an HTTP service, a span is created at the start of an HTTP request and completed when the HTTP server returns a response. Span attributes contain important information about that operation (such as duration, host data, etc.), including trace-relationship details (such as traceId, guid). For span-related data, see span attributes.Transaction: If an entity in a trace is monitored by an agent, a request to that entity generates a singleTransactionevent. Transactions allow trace data to be tied to other New Relic features. For transaction-related data, see transaction attributes.- Contextual metadata. We store metadata that shows calculations about a trace and the relationships between its spans. To query this data, use the NerdGraph GraphiQL explorer.
How trace context is passed between applications
We support the W3C Trace Context standard, which makes it easier to trace transactions across networks and services. When you enable distributed tracing, New Relic agents add HTTP headers to a service's outbound requests. HTTP headers act like passports on an international trip: They identify your software traces and carry important information as they travel through various networks, processes, and security systems.
The headers also contain information that helps us link the spans together later: metadata like the trace ID, span ID, the New Relic account ID, and sampling information. See the table below for more details on the header:
Item | Description |
|---|---|
| This is your New Relic account ID. However, only those on your account and New Relic Admins can associate this Id with your account information in any way. |
| This is the application ID of the application generating the trace header. Much like |
| With Distributed Tracing, each segment of work in a trace is represented by a |
Parent type | The source of the trace header, as in mobile, browser, Ruby app, etc. This becomes the |
Priority | A randomly generated priority ranking value that helps determine which data is sampled when sampling limits are reached. This is a float value set by the first New Relic agent that’s part of the request so all data in the trace will have the same priority value. |
Sampled | A boolean value that tells the agent if traced data should be collected for the request. This is also added as an attribute on any span and transaction data collected. |
Timestamp | Unix timestamp in milliseconds when the payload was created. |
| The unique ID (a randomly generated string) used to identify a single request as it crosses inter- and intra- process boundaries. This ID allows the linking of spans in a distributed trace. This also is added as an attribute on the span and transaction data. |
| The unique identifier for the transaction event. |
Trusted account key | This is a key that helps identify any other accounts associated with your account. So if you have multiple sub-accounts that the trace crosses, we can confirm that any data included in the trace is coming from a trusted source, and tells us what users should have access to the data. |
Version and data key | This identifies major/minor versions, so if an agent receives a trace header from a version with breaking changes from the one it is on, it can reject that header and report the rejection and reason. |
This header information is passed along each span of a trace, unless the progress is stopped by something like middleware or agents that don't recognize the header format (see Figure 1).

Figure 1
To address the problem of header propagation, we support the W3C Trace Context specification that requires two standardized headers. Our latest W3C New Relic agents send and receive these two required headers, and by default, they also send and receive the header of the prior New Relic agent:
- W3C (
traceparent): The primary header that identifies the entire trace (trace ID) and the calling service (span id). - W3C (
tracestate): A required header that carries vendor-specific information and tracks where a trace has been. - New Relic (
newrelic): The original, proprietary header that is still sent to maintain backward compatibility with prior New Relic agents.
This combination of three headers allows traces to be propagated across services instrumented with these types of agents:
- W3C New Relic agents
- Non-W3C New Relic agents
- W3C Trace Context-compatible agents
중요
If your requests only touch W3C Trace Context-compatible agents, you can opt to turn off the New Relic header. See the agent configuration documentation for details about turning off the newrelic header.
The scenarios below show various types of successful header propagation.


