A Kubernetes system is inherently complex and has a reputation as challenging to grasp. Understanding Kubernetes as a concept is a complex task by itself and wanting to understand a specific Kubernetes system only adds more complexity. How do you troubleshoot ephemeral containers that spin up and down before you can access them? How do you understand the health of your system as a whole if you have hundreds of containers orchestrated at a time? How do you parse out the intricate systems into functional layers?
In this tutorial series, you will learn how to monitor your Kubernetes system with New Relic and how it can streamline your understanding of the Kubernetes as a whole.
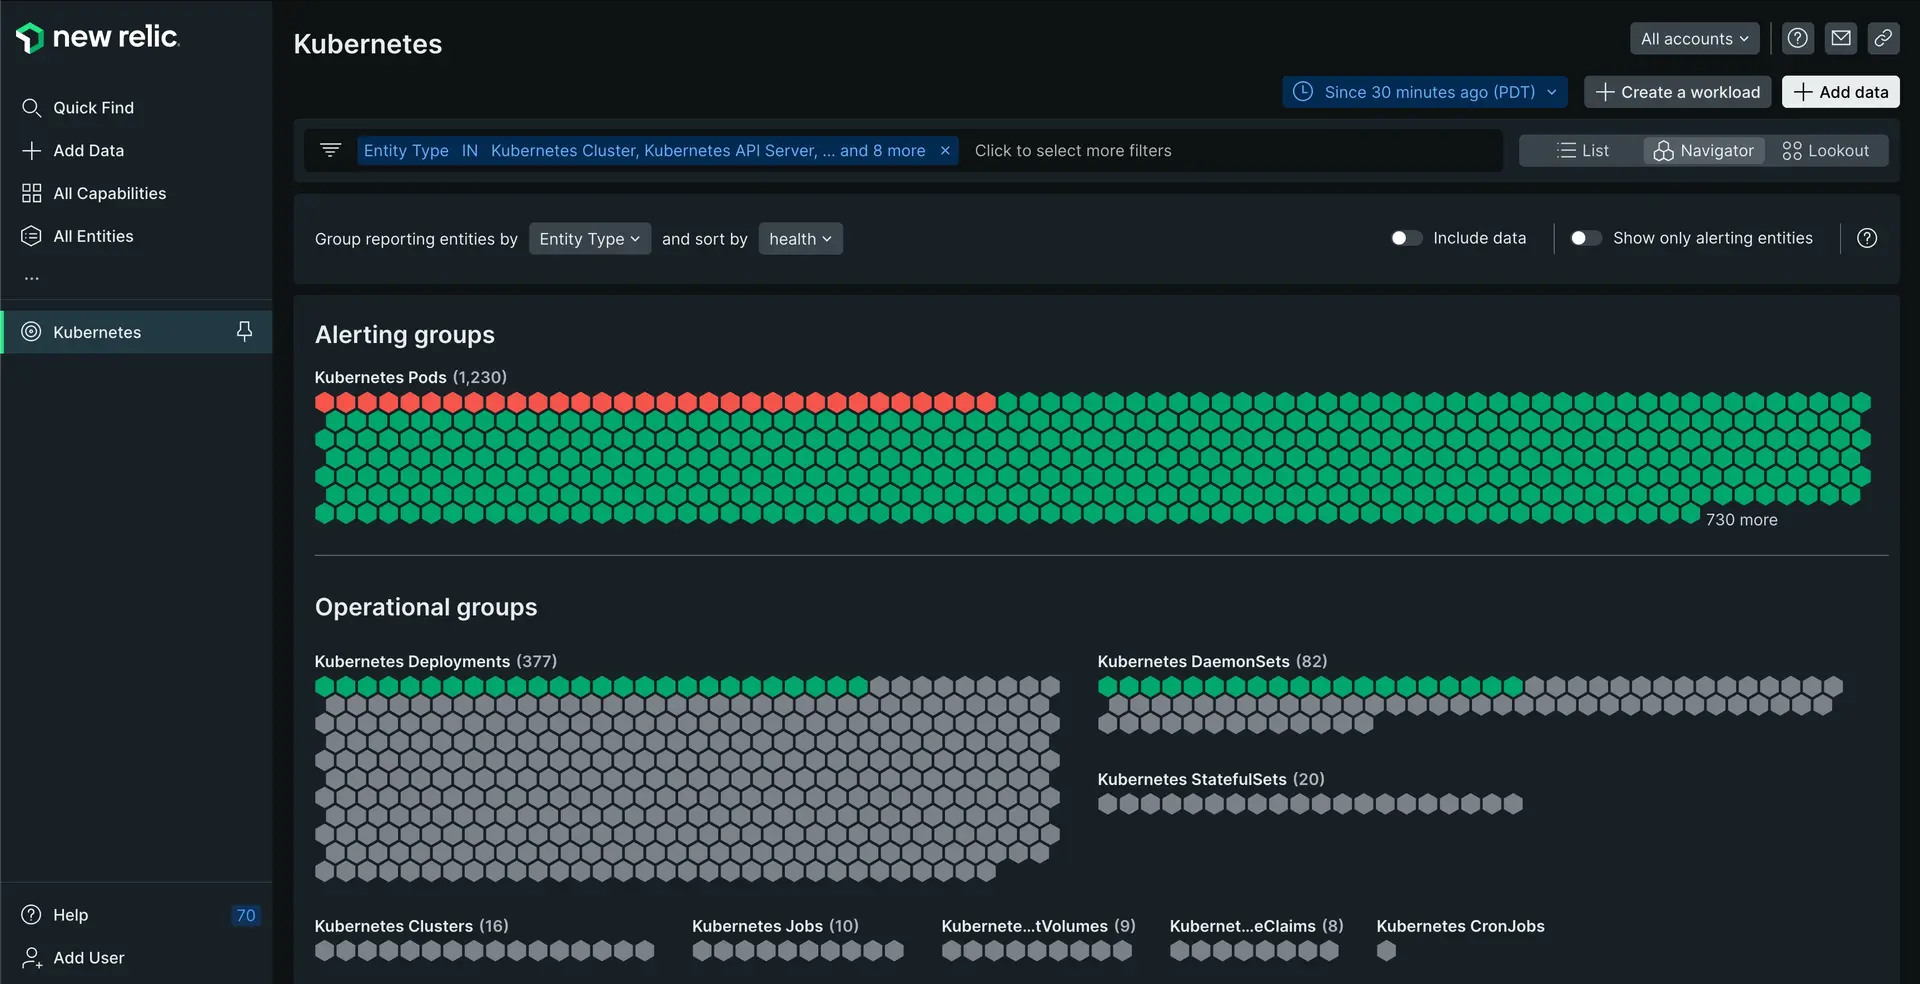
Set up New Relic:
To begin, you need to set up New Relic with your Kubernetes system. The steps below guide you though the process:
Install New Relic agent:
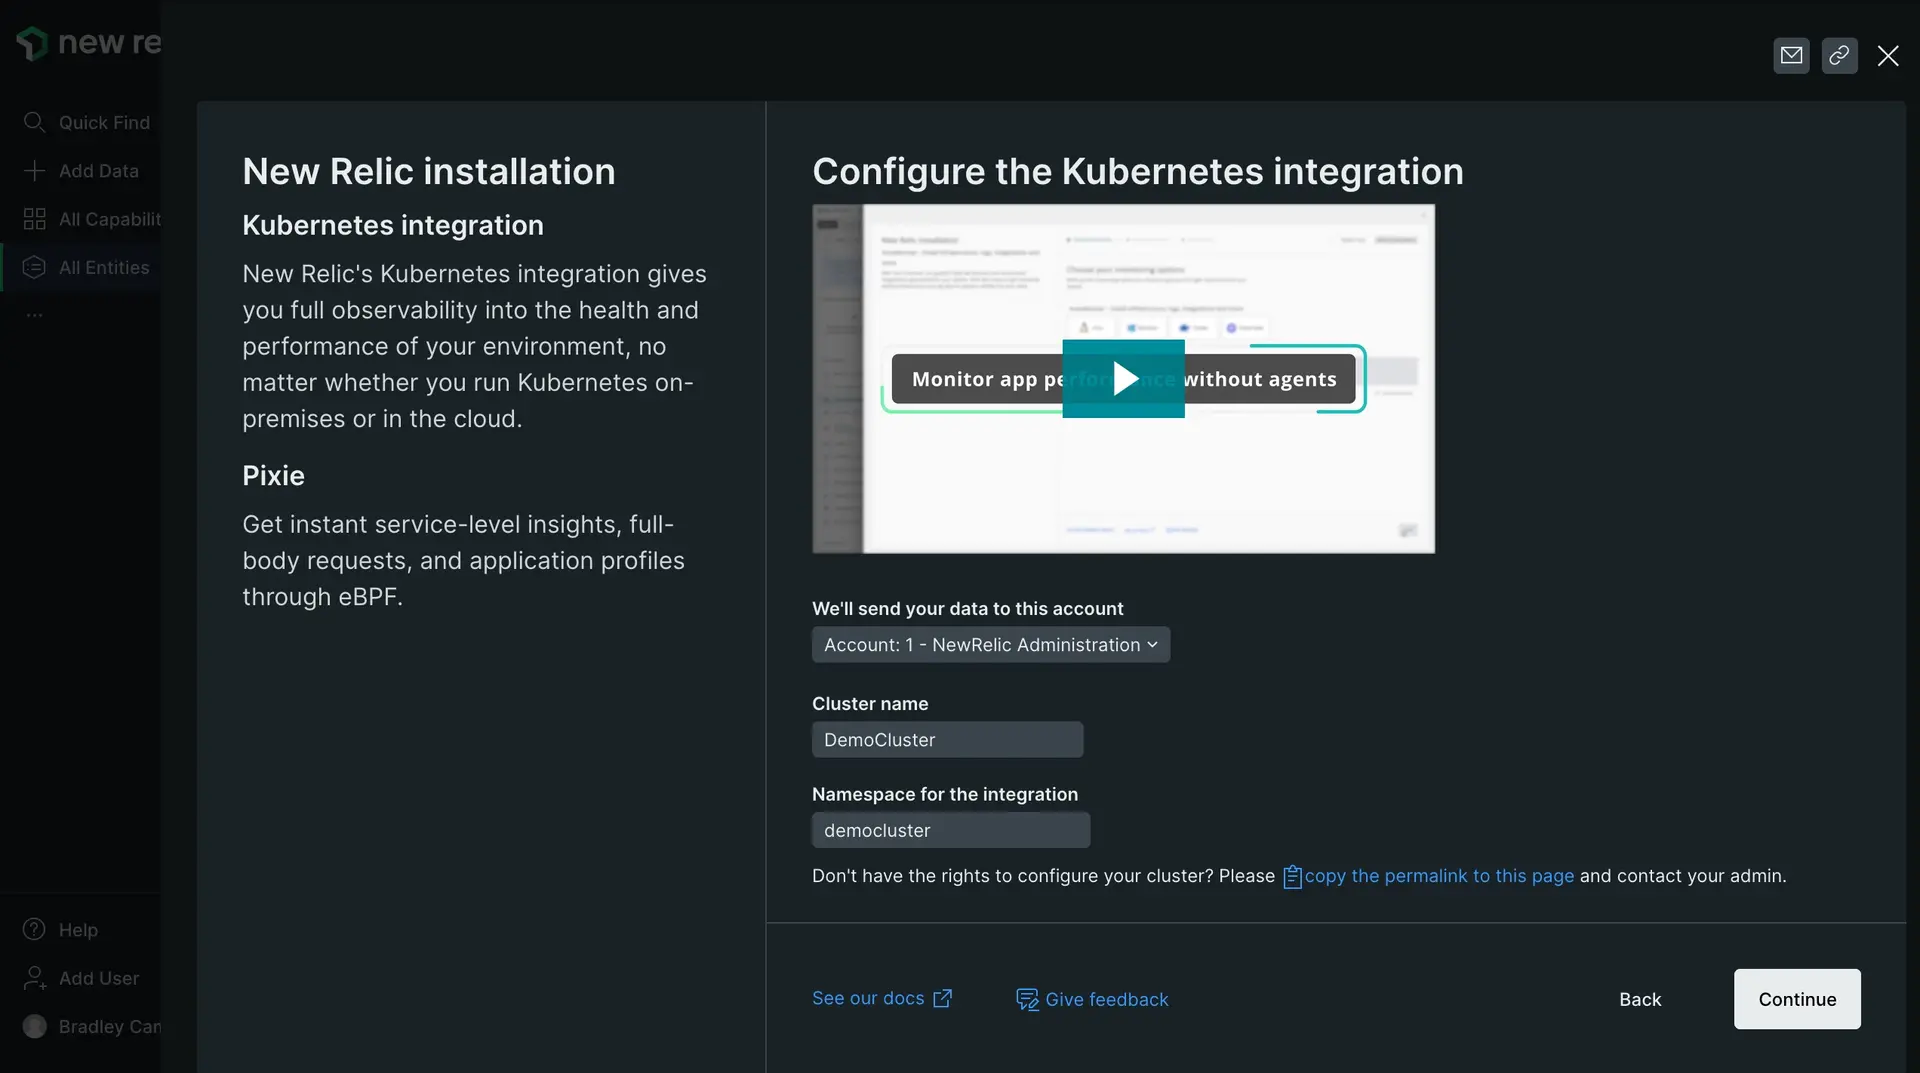
The New Relic Kubernetes integration gives you full observability into the health and performance of your environment. With the data it provides, you can monitor the health of your entire Kubernetes cluster, check individual pods, or drill into specific services and applications. This agent collects telemetry data from your cluster using several New Relic integrations such as the Kubernetes events integration, the Prometheus Agent, and the New Relic Logs Kubernetes plugin.
There are various ways to integrate your Kubernetes system. For this tutorial series, we highly recommend using the guided install steps below. For other install paths, see our Kubernetes install docs.
Guided install option | Description |
|---|---|
Use this if your New Relic organization does not use the EU data center, and you don't need the bonus dashboards and from the quickstart. | |
Use this if your New Relic organization uses the EU data center, and you don't need the bonus dashboards and alerts from the quickstart. | |
Use this option if your New Relic organization does not use the EU data center, and you also want to install some bonus dashboards and alerts from the quickstart. |
ヒント
Additionally, you can monitor Kubernetes clusters using our Auto-telemetry with Pixie. Learn more about Auto-telemetry with Pixie here.
This tutorial doesn't cover Pixie concepts, but there are various other tutorials you can follow.
Send data from your applications
Running dozens or hundreds of containers causes toil and difficulty to maintain. Kubernetes abstracts containers into higher level concepts, with the cluster as the highest level. This abstraction helps you understand your cluster as a whole, but makes it difficult to understand what is happening at an application level.
To reduce this complexity, you can report data from your containerzied applications to New Relic. This not only allows you to see the health of your applications, but also lets you correlate application data to the underlying Kubernetes infrastructure.
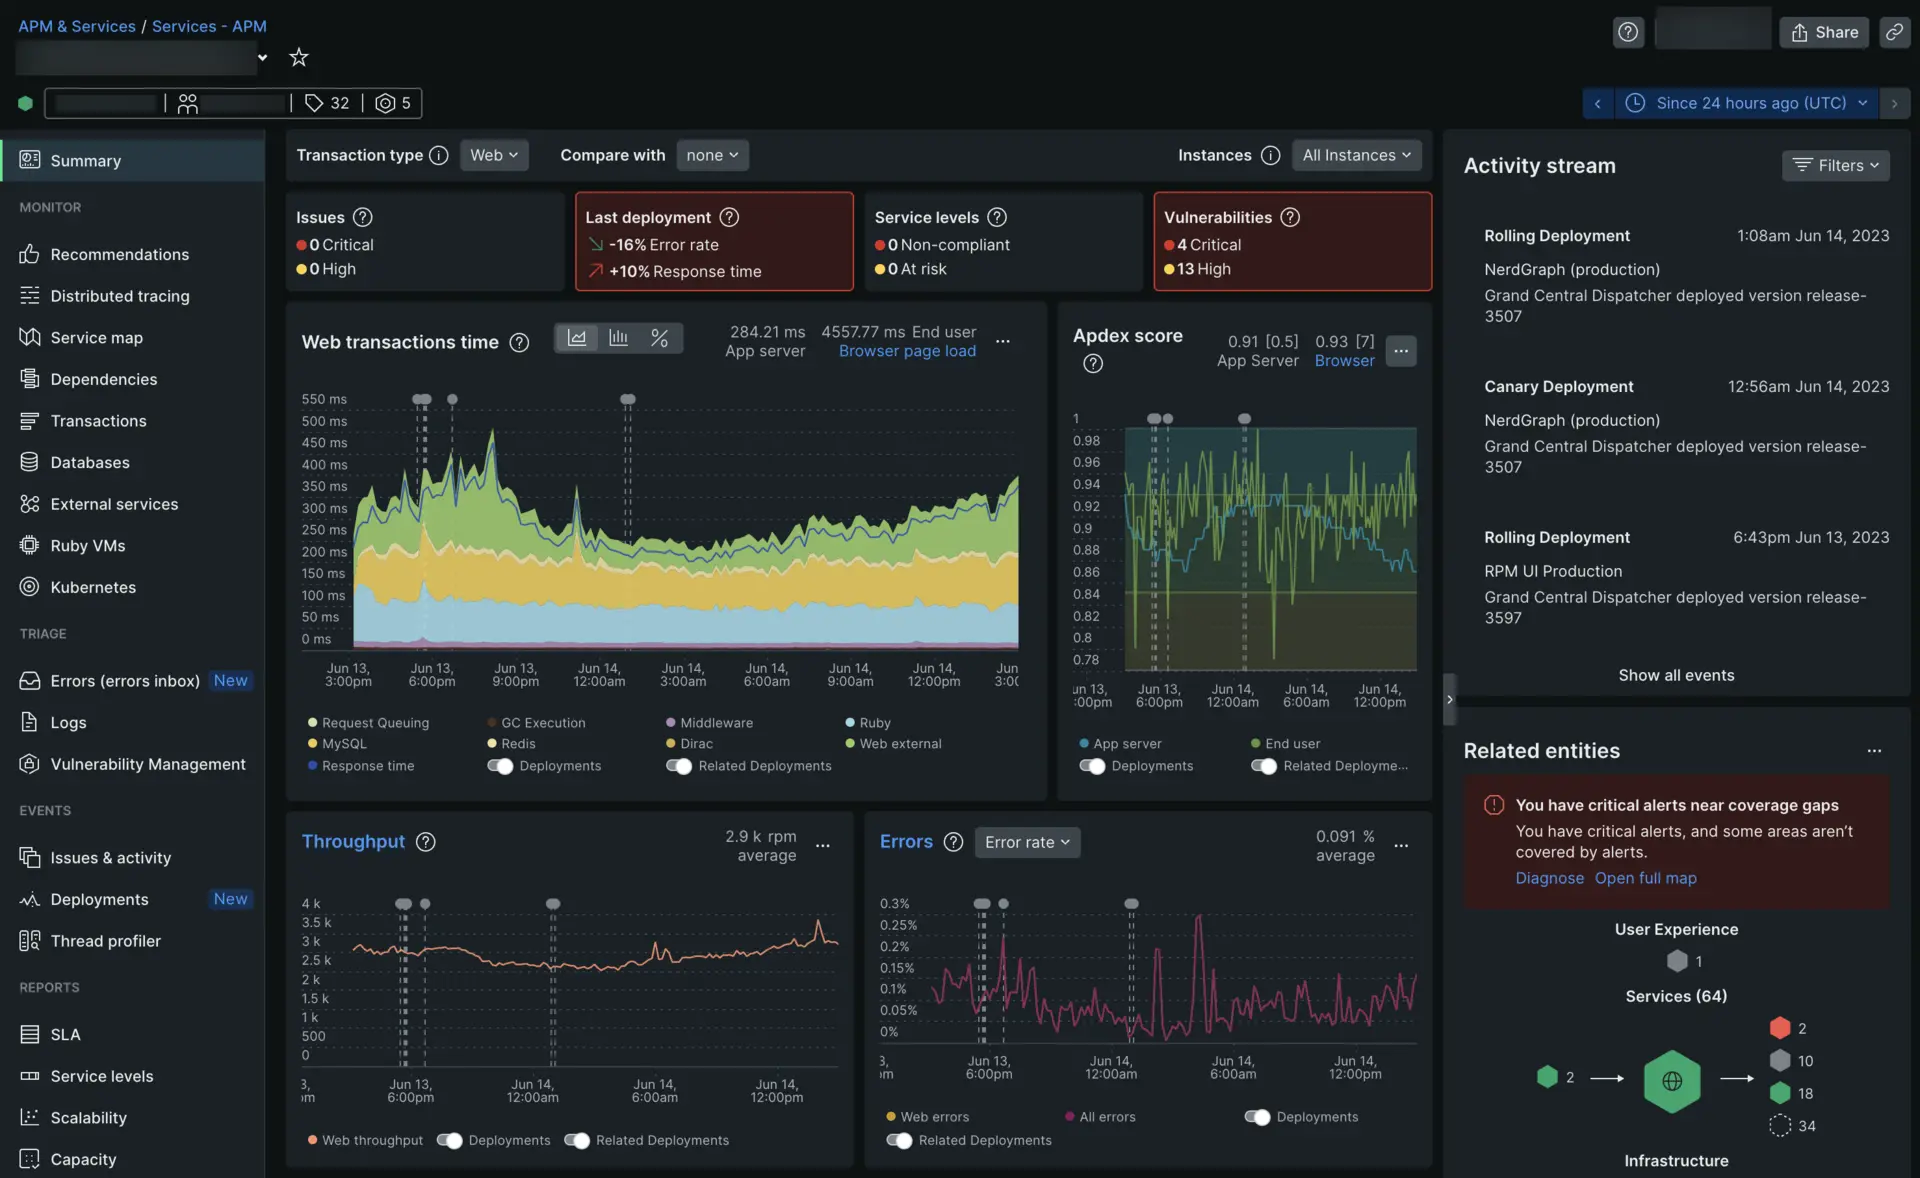
Follow the instruction in this document to correlate data from applications in your pods to the cluster. You will use our application performance monitoring (APM) capabilities to scrape your applications for performance data and send them to New Relic.
Send data from your services
Correlating services such as Cassandra and MySQL with your Kubernetes data requires configuration similar to how you reported application data.
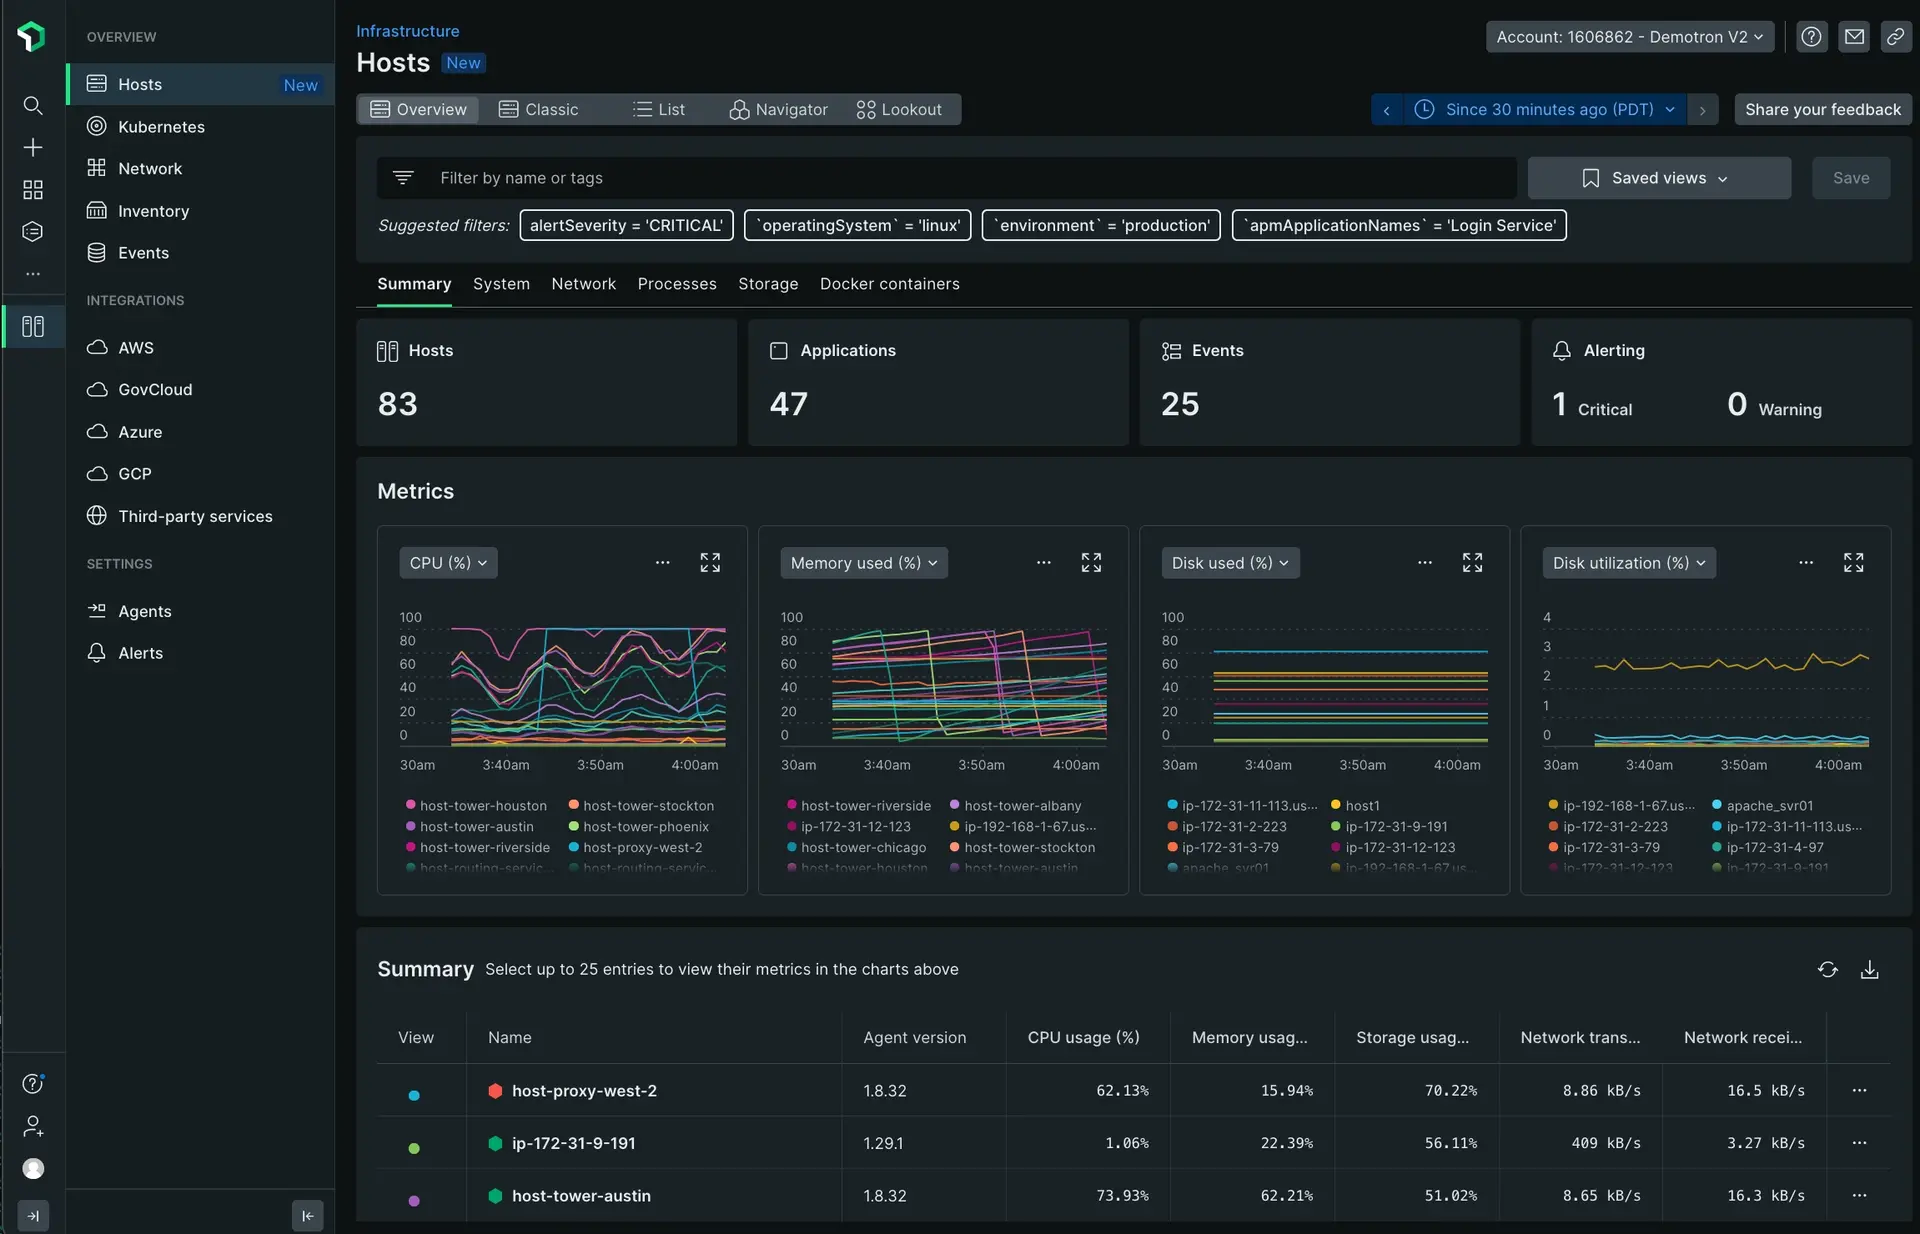
To correlate your data, see our doc on monitoring services in Kubernetes. This process will use our on-host integrations for various supported services using a Helm Chart.
Explore your data
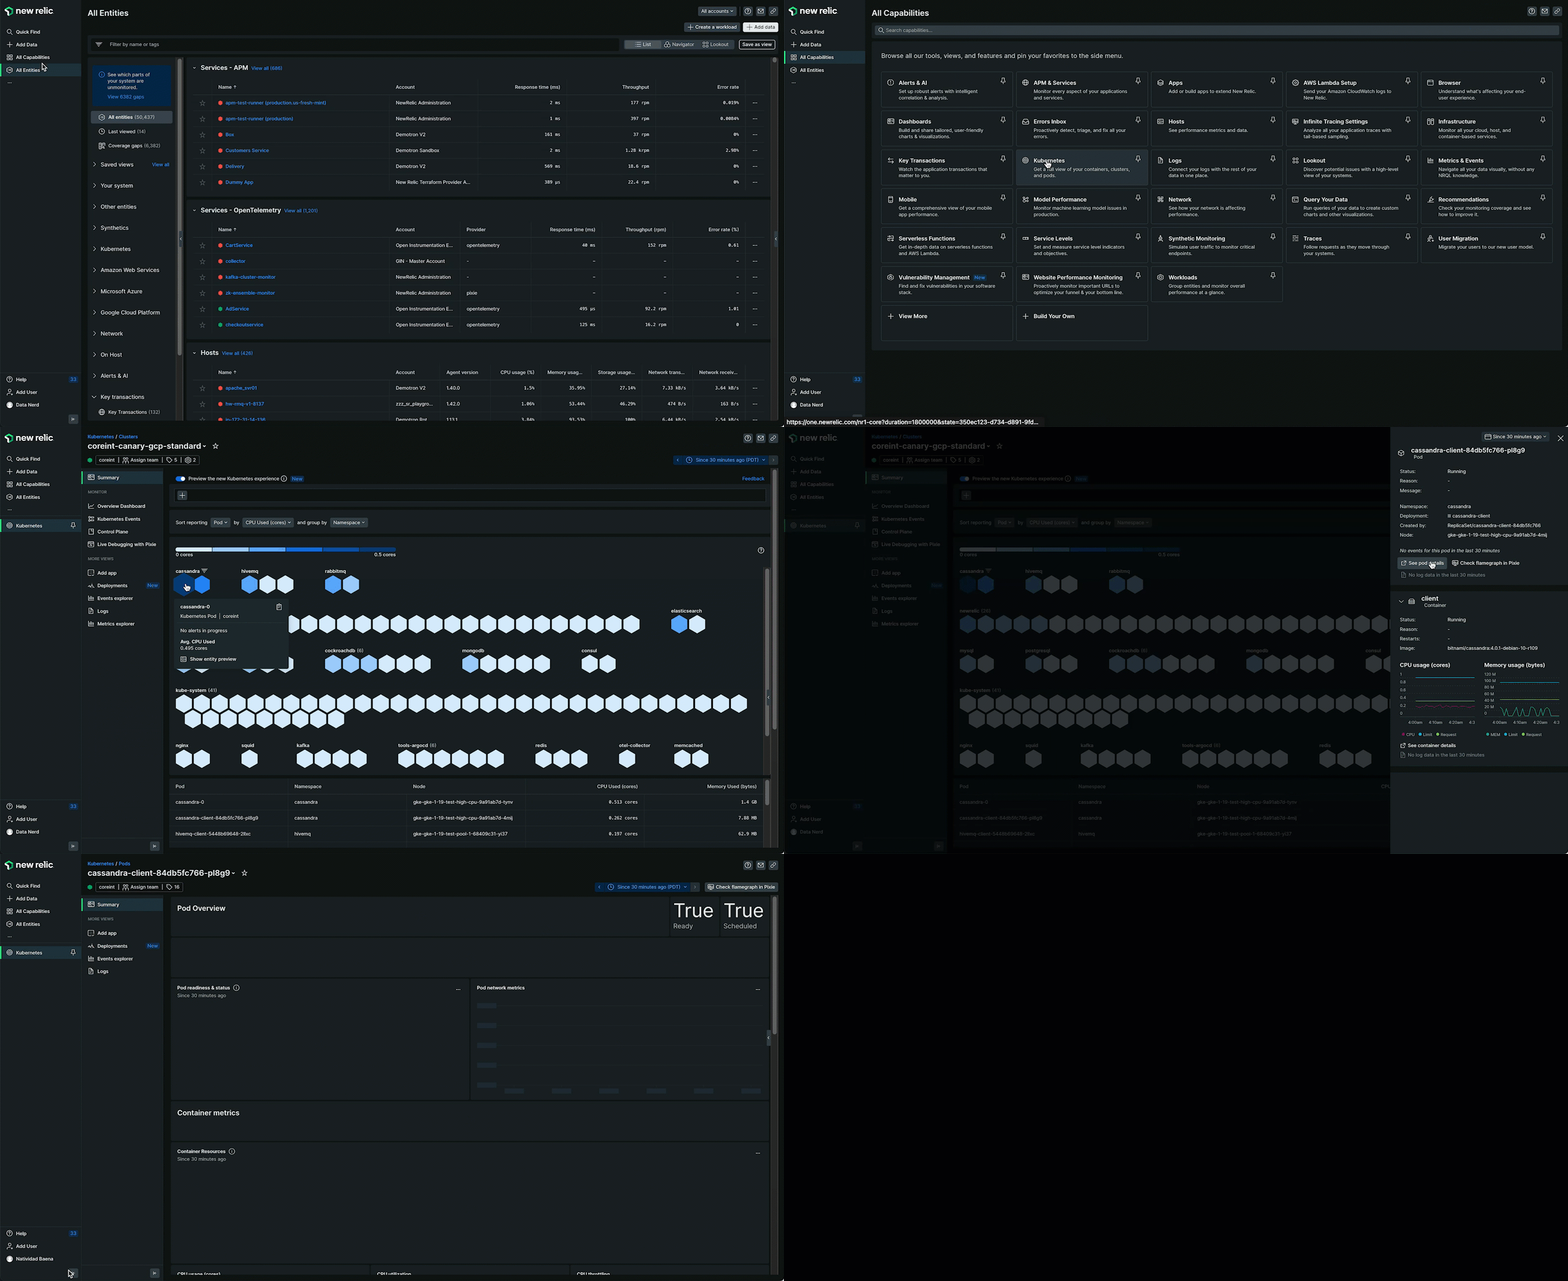
To confirm you're sending all your Kubernetes related data to New Relic, explore the Kubernetes charts. Go to one.newrelic.com > All capabilities > Kubernetes. Poke around your data and see if you can get a general sense your Kubernetes system's health. Confirm you're seeing data for your entire cluster, individual pods, and any services and applications you expect. Once you're ready, proceed to the next steps.
Next steps
You're now sending Kubernetes data to New Relic! The next steps in this tutorial will teach you to gauge the health of your system and understand how it's all working together. Each doc will dive into how New Relic can help monitor and understand an individual layer of Kubernetes.