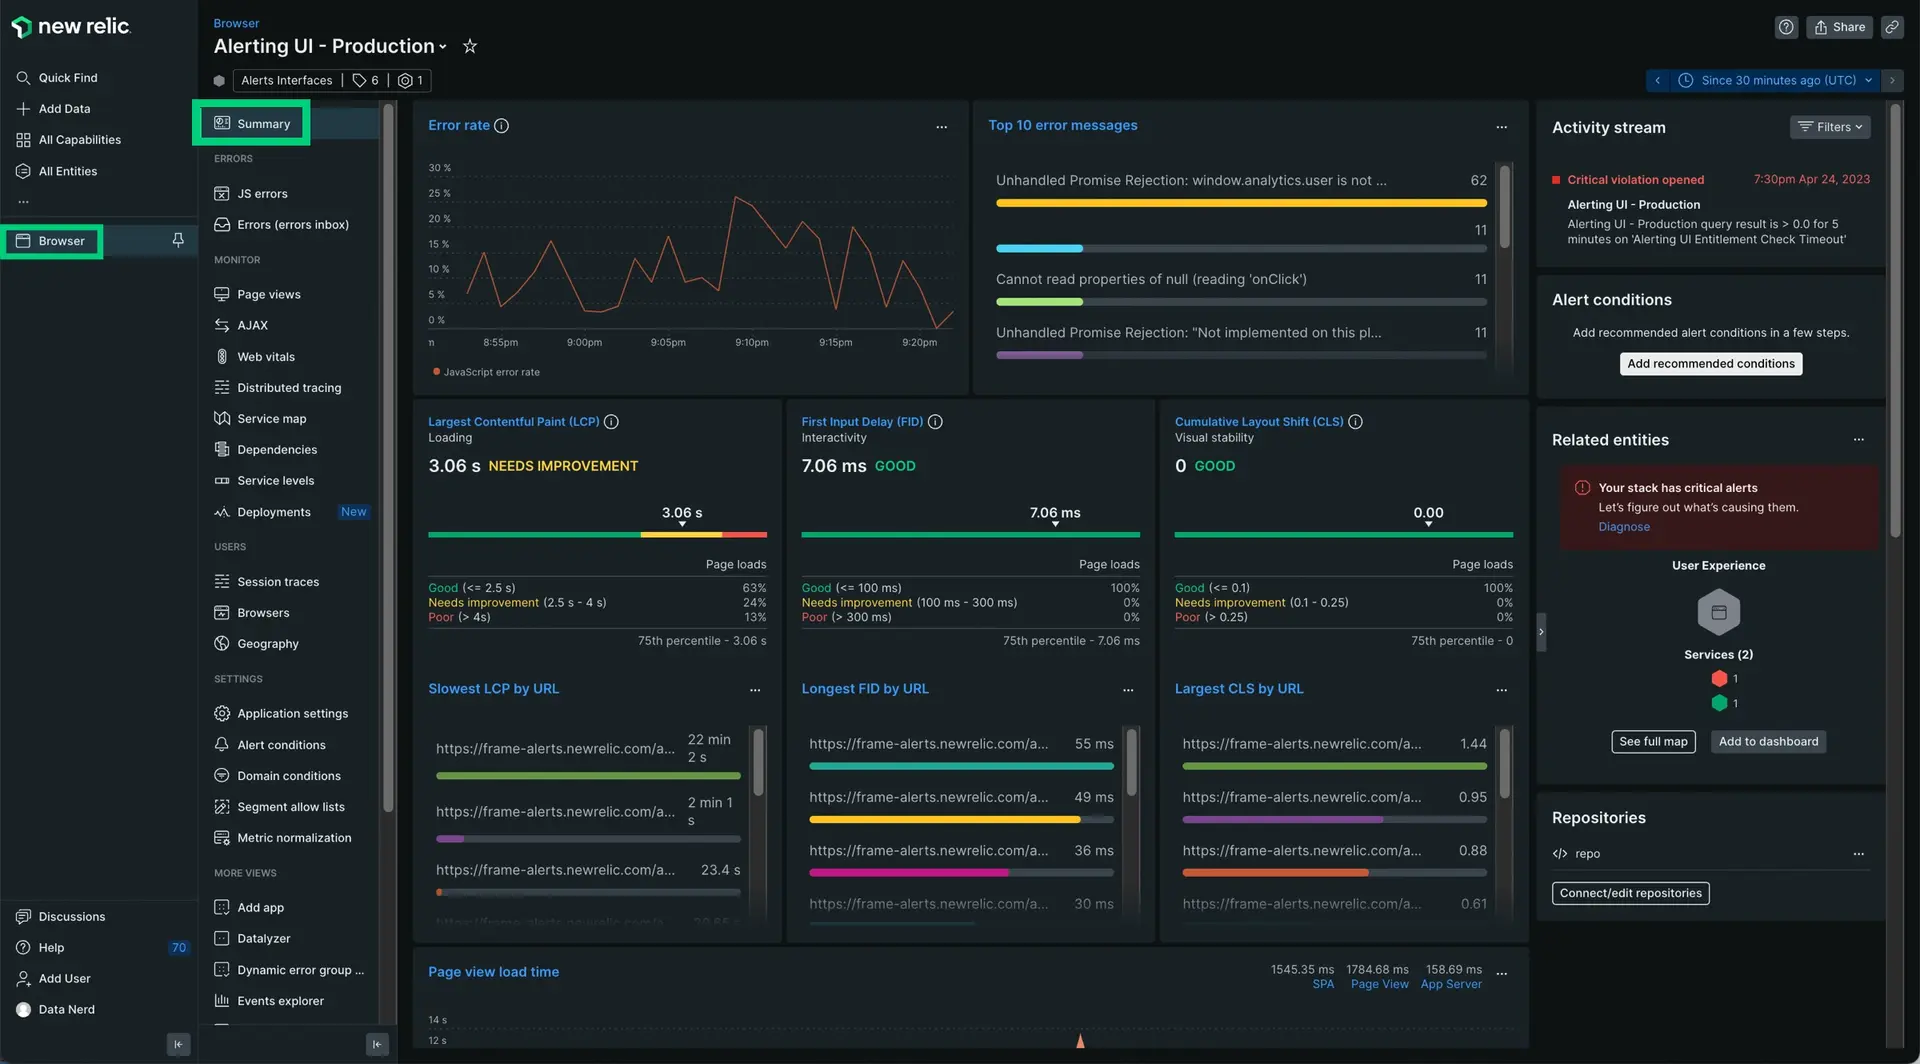
A good website — you know it when you see it, right? You never notice any load times, it's available whenever you need it, and, of course, errors are nowhere to be found. But measuring your site's performance is tricky, and improving it is even trickier.
This tutorial walks you through how to use New Relic to improve your site's experience. To get started, you'll instrument your site. Instrumenting means adding some JavaScript code that measures the actual end-user experience for each visit. From there, you'll learn how to evaluate your site's performance today, where you can improve it, and how you can keep an eye on things in future.

Once you instrument your site, you can get insights about your site performance over time.
Capture performance data about your site
Before you can improve your site's performance, you need data to make informed decisions about what your site needs. New Relic monitoring always starts with an integration, or a piece of code that collects data from a relevant technology and reports it to New Relic.
To monitor the frontend of your website, you'll want to use our browser monitoring agent integration. It's a small snippet of JavaScript that you'll include in your HTML <head>, very similar to Google Analytics or other scripts.
There are two basic ways to install the agent:
You can deploy the agent by itself by copy-pasting the JavaScript snippet into whatever part of your code generates the <head> for your webpage.
If you're monitoring your backend with one of our APM agents, it can automatically inject the browser monitoring agent into the appropriate part of your webpage.
Analyze site performance
Once you've instrumented your site, you can overview your site's performance with different types of data.
- Core web vitals. These are metrics that give you insight into your site user experience. Low scores often indicate a poor experience, which can deteriorate your relationship with your end users.
- High latency. This can frustrate your users and cause them to stop using your site altogether.
- JavaScript errors. This can cause a number of issues with your site, any one of which could negatively impact the frontend experience for your customers. New Relic dedicates an entire JS errors page for your integrated apps.
- Benchmarks. Site performance can dip below acceptable levels without necessarily causing major errors. You can create service-level benchmarks to help track your sites performance, and identify issues before they become problems.
Ready to work through the rest of the tutorial?