It is crucial to allocate sufficient resources to the gateway to maintain its reliability and prevent data loss. If the gateway goes down, you risk losing telemetry data, which can impact your monitoring and analytics capabilities.
This guide helps you determine the appropriate resources for deploying and scaling Pipeline Control gateway in your environment. Understanding these specifications is essential for ensuring optimal performance and efficient data processing.
Default configuration
By default, the gateway is configured with a default memory allocation of 2 GB and 1 vCPU per pod. Additionally, the gateway cluster is initially configured during setup with the following settings (these can be modified after initial gateway setup):
minReplicas: 2 maxReplicas: 10 targetCPUUtilizationPercentage: 60
Scaling the gateway
The Pipeline Control gateway must maintain enough compute capacity to process the entirety of telemetry data it receives. Given the variable sizes and throughputs of different agents and telemetry workloads, we recommend taking a staged approach to scaling your gateway cluster in order to forecast how much capacity you might need:
- Configure a small set (~15-35) of non-production agents to send telemetry data to the gateway. Ensure these agents are representative of the types of agents and telemetry payloads you intend to intend to send to the gateway in production (for example, New Rrelic infraestructura, Java APM, and Fluent Bit). Take note of the number of agents of each.
- Confirm that you're collecting this telemetry data in New Relic.
- Monitor the gateway cluster to identify the number of vCPUs and average CPU usage over a few minutes of load. This will give you an idea of how many vCPUs are needed to run this set of agents.
- Linearly extrapolate based on the number of agents you've configured, the number of agents you expect to run in peak production, and the CPU usage in step 3. E.g. if you're running 25 Java APM agents through the gateway, and you're seeing only 1 vCPU run at 65% load, you should expect to be able to run 200 Java APM agents with
<=8 vCPUs. - Configure a greater set of agents to send data to the gateway (for example, 100) and confirm that your linear extrapolation in step 4 still holds true.
- Ensure that your
maxReplicasis large enough to scale enough pods per the number of agents you expect to run in production. - After you configure all production agents and telemetry data to send data to the gateway, continue monitoring your gateway clusters to ensure that they are not operating at or beyond 100% capacity.
Performance specifications
With a single CPU core and 100 drop rules per MELT type, the gateway can process the following volumes of telemetry data:
Data type | Processing capacity |
|---|---|
Metrics | 7,000 data points per second |
Events | 4,500 events per second |
Logs | 2,700 logs per second |
Traces | 3,300 spans per second |
Agent handling capacity
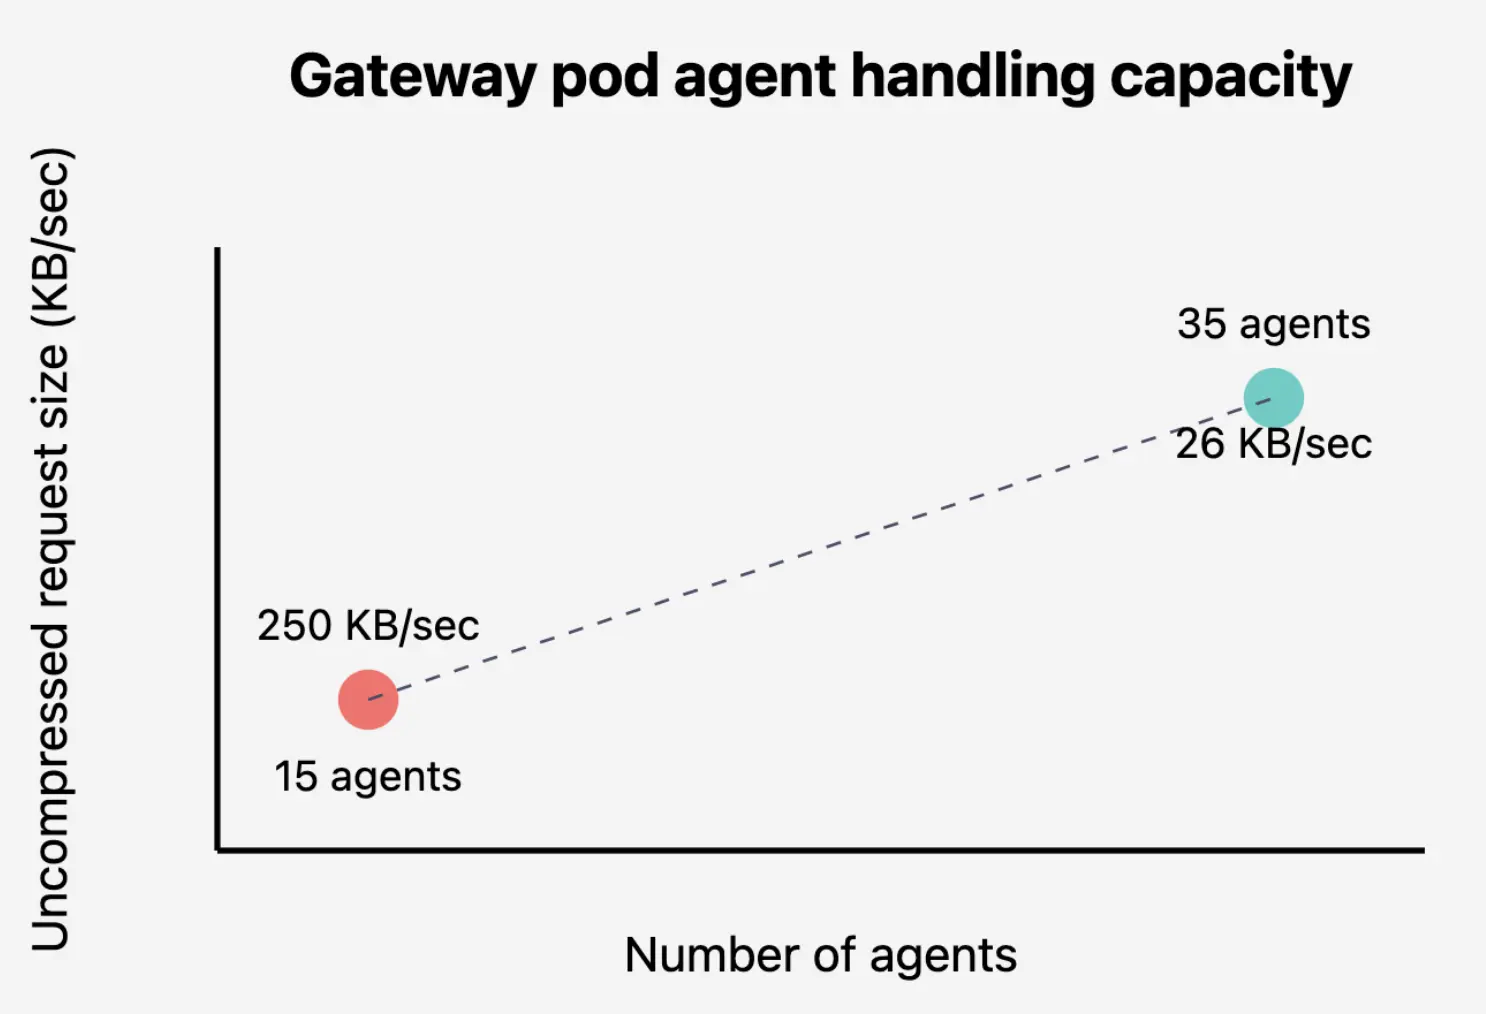
A single gateway pod can handle between 15-35 agents, with request sizes ranging from 26-250 KB of uncompressed data per second.

ヒント
These capacity estimates are based on measurements from existing deployments. Your actual requirements may vary depending on your specific data patterns and monitoring needs.
Recommendations for gateway configuration
To further enhance your gateway's performance and scalability, consider the following configuration settings based on your agent mapping. To access these settings, go to New Relic Control > Gateway > Settings.
Minimum and maximum replicas
- Minimum replicas: Set a baseline number of gateway replicas to accommodate regular data loads, ensuring redundancy and reliability. This helps prevent data loss and maintains performance stability during peak periods. The minimum recommended value is 2, which is also the default setting.
- Maximum replicas: Determine the maximum number of replicas required to handle peak usage periods effectively. This configuration enables the gateway cluster to scale dynamically, providing sufficient resources for high traffic without compromising performance. You can set up to a maximum of 15 replicas.
CPU utilization threshold
- Scaling threshold: Specify the CPU utilization percentage at which your gateway cluster will automatically scale. Configuring a scaling threshold ensures efficient resource management, preventing overcrowding and maintaining steady data processing. The default setting is 60%.
Health and performance management
- Gather diagnostic logs: Regularly check gateway diagnostic logs for insights into gateway health and operation. Monitoring logs is essential for timely troubleshooting and maintaining optimal performance. By default, diagnostic logging is turned off.
- Bypass gateway rules: In instances of low available CPU resources, bypass complex gateway rules. This precaution ensures continued data flow to New Relic, even if sensitive data is received, allowing resource conservation and uninterrupted telemetry processing. By default, bypassing gateway rules is turned off.
Next step
Next, you learn how to modify your agent configuration to send data via the gateway.