Whatever your application architecture, we have solutions for reporting your logs to New Relic.
When you use our agents, infrastructure agent, or OpenTelemetry integration to report log data, you get logs in context, a feature that lets you see your log data in the context of other platform UI experiences. For example, you'll see logs data in UI experiences like APM, infrastructure monitoring, distributed tracing, and errors inbox, to name a few. With that contextual knowledge, you can then dig deeper into the performance of your app or host, without needing to manually search through log data.
To see how logs in context can help you find the root cause of an issue in your apps and hosts, watch this short video (approx. 4:00 minutes):
ヒント
Got lots of logs? Check out our tutorial on how to optimize and manage them.
See the root cause of issues across your platform
By bringing all of your application and infrastructure data together in a single solution, you can get to the root cause of issues faster. Logs in context help you quickly see meaningful patterns and trends.
Don't spend extra time trying to narrow down all your logs from different parts of your platform. Instead, enable logs in context to see the exact log lines you need to identify and resolve a problem.
APM logs in context
Our agents have logs in context, including log forwarding, enabled by default. For more about getting and using logs in context, see APM logs.

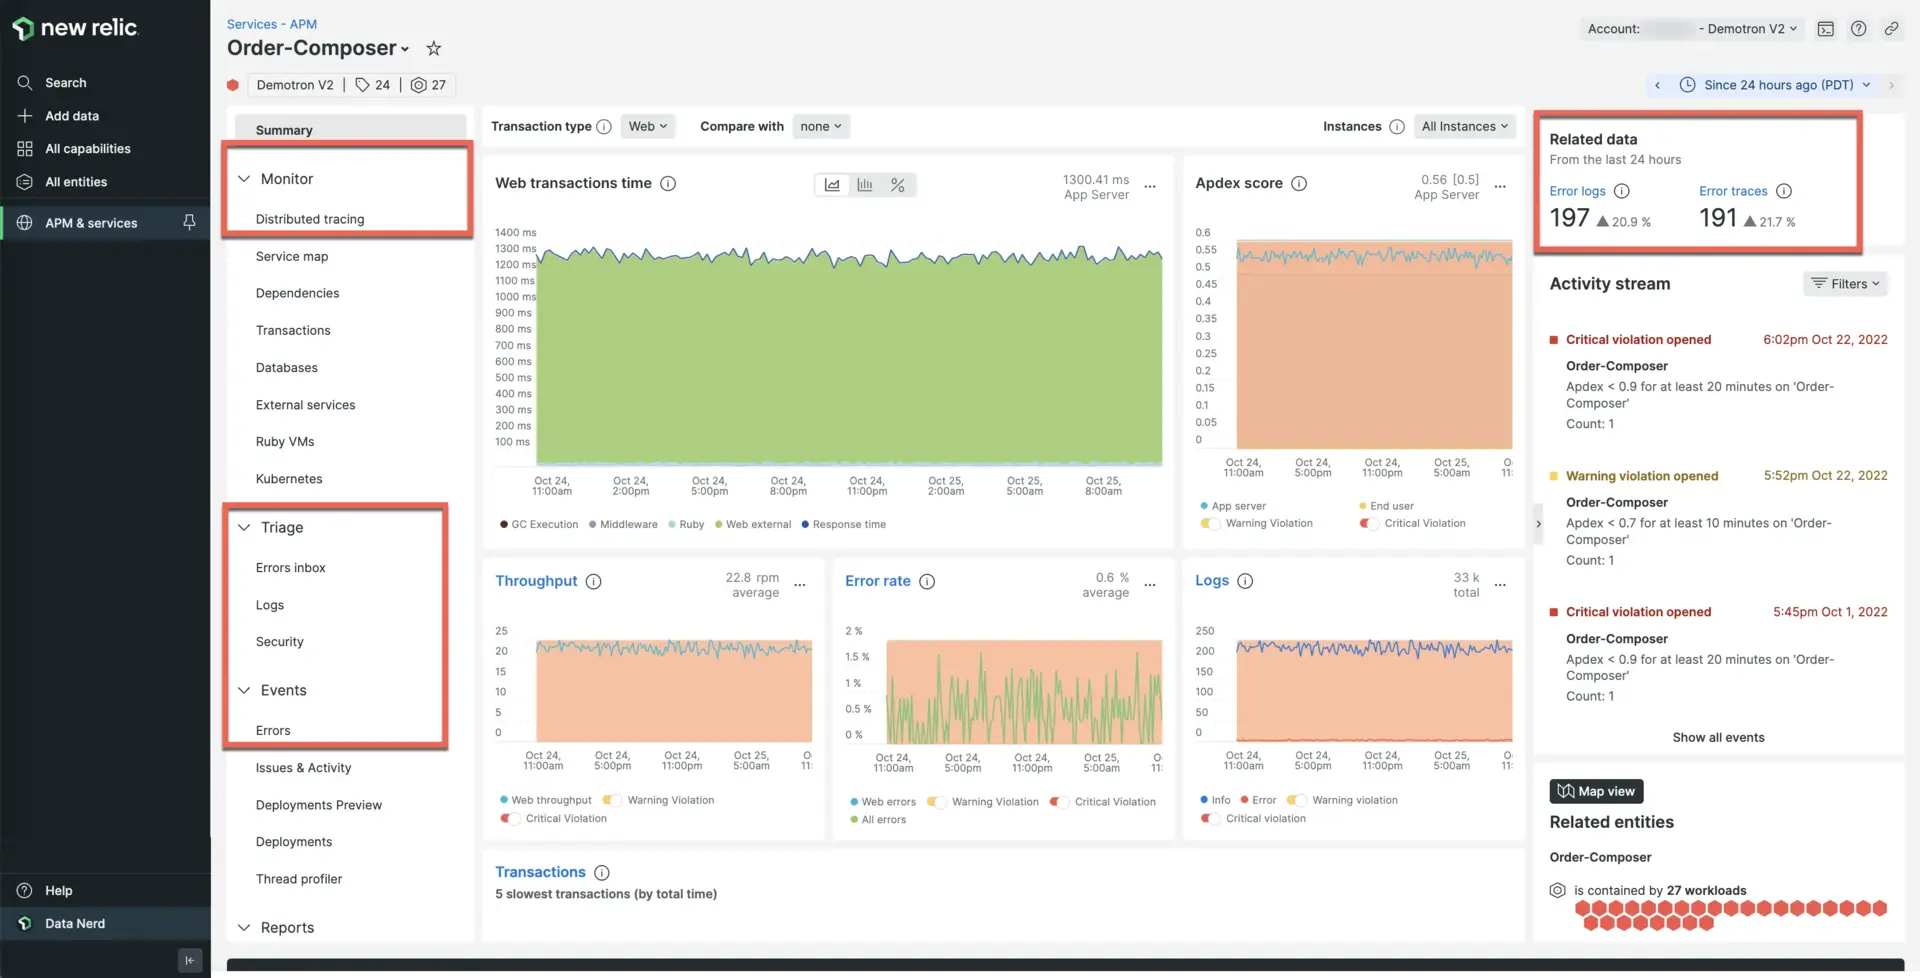
With our automatic APM logs in context, you can drill down into your logs, traces, and errors, all from the APM Summary page.
Infrastructure logs
As a more powerful alternative to using an agent for log reporting, or as a supplement to APM logs, you can forward logs with our infrastructure agent.
Other log reporting options
For more solutions for forwarding your logs to New Relic, see Introduction to logs.
このドキュメントはインストールの役に立ちましたか?
What's next?
After you set up logs in context for APM or infrastructuring monitoring, make the most of your logging data in the New Relic UI:
- Explore the logging data across your platform with our logs UI.
- See your logs in context of your app's performance in the APM UI. Troubleshoot errors with distributed tracing, stack traces, application logs, and more.
- Set up alerts.
- Query your data and create dashboards.