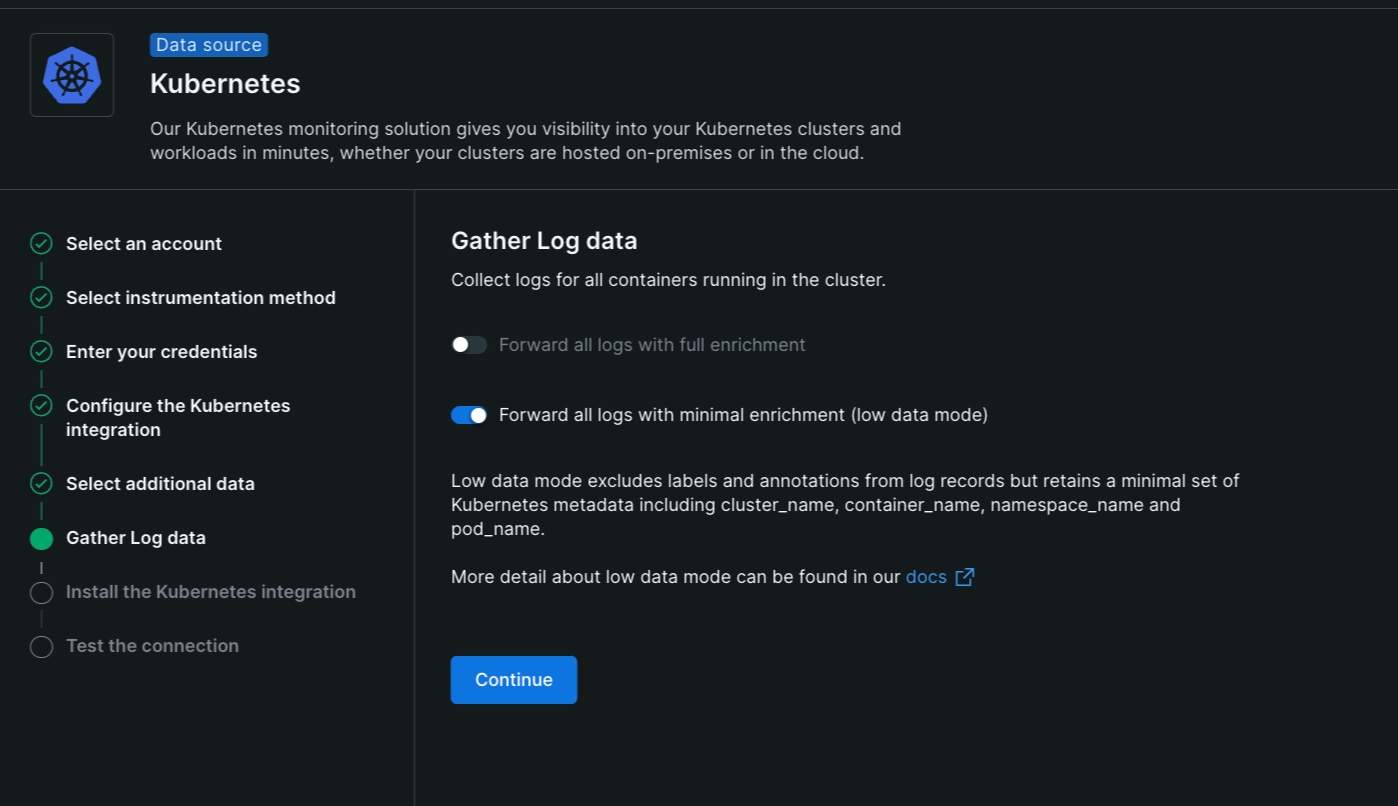
New Relic's Kubernetes plugin for log forwarding simplifies sending logs from your cluster to New Relic logs. It uses a standalone Docker image and runs as a DaemonSet, seamlessly collecting logs for centralized analysis and troubleshooting. Forwarding your Kubernetes logs to New Relic will give you enhanced capabilities to collect, process, explore, query, and alert on your log data.
Enable Kubernetes for log management
To forward your Kubernetes logs to New Relic with our plugin:
Install the New Relic Kubernetes integration. This integration includes the Kubernetes plugin for logs.
Optionally, you can further tune your installation in the guided install using the numerous configuration options available in the
newrelic-loggingrepository. However, we recommend the standard setup, as it's valid for most users.
Go to one.newrelic.com > Integrations & Agents and click the Guided install tile. Then select Kubernetes and Guided.
重要
If you're using a Kubernetes secret to store the New Relic , the
newrelic-loggingchart defaults to sending logs to the US API endpoint. If the license key belongs to an EU or FedRAMP account, and a secret is used for key storage, you must update the endpoint setting with the appropriate value from the API reference docs. Here's an example of how to set this for EU accounts:newrelic-logging:enabled: trueendpoint: https://log-api.eu.newrelic.com/log/v1Generate some traffic and wait a few minutes, then check your account for data.
このドキュメントはインストールの役に立ちましたか?
Fluent Bit output plugin
New Relic has a Fluent Bit output plugin to forward your logs to New Relic log management. This plugin is also provided in a standalone Docker image that can be installed in a Kubernetes cluster in the form of a DaemonSet, also known as the Kubernetes plugin.
See Fluent Bit plugin for log forwarding for more details about it.
Additional metric details
Starting from version 1.24.0 of the newrelic-logging Helm chart, internal metrics are sent by default using the prometheus_scrape input plugin in conjunction with the prometheus_remote_write output plugin. The sendMetrics: true configuration option is now responsible only for sending the output plugin metrics of newrelic-fluent-bit-output:
Fluent Bit internal metrics: Emitted by Fluent Bit in Prometheus format and delivered to New Relic's Prometheus export endpoint. They can be faceted by
cluster_name,node_name, andpod_name.We capture Fluent Bit's internal metrics by using its
prometheus_scrapeinput plugin together with theprometheus_remote_writeoutput plugin. All Prometheuscountermetrics are cumulative counters, but we automatically perform a delta conversion when they are ingested at New Relic to ease querying them using NRQL later. More details can be found here.Internal plugin metrics from
newrelic-fluent-bit-output: These metrics are collected by the output plugin and sent to New Relic's metric API whensendMetrics: trueis enabled. They include thecluster_namedimension, allowing them to be narrowed down to a particular cluster but not to a specific host or pod. These metrics are useful for assessing overall latency when delivering logs to the New Relic Logs API or identifying potential packaging issues.
Troubleshoot your Kubernetes plugin for log forwarding installation
Sometimes, despite correctly installing the Kubernetes log forwarding plugin (newrelic-logging Helm chart), you may encounter performance issues affecting the correct delivery of logs. In such cases, examining the log forwarder's internal metrics may help identify the cause of the problem.
The newrelic-logging Helm chart provides a configuration setting to enable the collection of such metrics for a given Kubernetes cluster. We also provide a JSON-formatted dashboard template to easily display all these metrics in New Relic.
To configure your Kubernetes cluster to send the log forwarder internal metrics and display them in a dashboard, follow these steps:
Install the Helm chart with the following extra configuration setting:
newrelic-logging:fluentBit:sendMetrics: trueYou only need to enable the
newrelic-logging.fluentBit.sendMetricssetting when troubleshooting a Kubernetes cluster. We recommend enabling it for a single Kubernetes cluster at a time to ease troubleshooting.The
newrelic-loggingHelm chart can be configured to forward internal metrics of the plugin to New Relic. This helps in monitoring and troubleshooting the log forwarding process.
View log data
Once you've set everything up and collected the data, you should see log data in both of these places:
Our logs UI
Our tools for running NRQL queries. For example, you can execute a query like this:
SELECT *FROM Log
If you don't see any data after enabling our log management capabilities, follow our standard log troubleshooting procedures.
Disable log forwarding
To disable log forwarding capabilities, you can uninstall the Kubernetes plugin by following these steps. You do not need to do anything else in New Relic.
Choose your next step
Logs UI
Explore logging data across your platform with our logs UI
Logs in context
Get deeper visibility into both your application and your platform performance data by forwarding your logs with our logs in context capabilities
Alerts
Create alerts to stay informed about issues that matter most
Create dashboards
See how to gather and chart the specific data you want to see