When clusters grow in size, there's more data gathered by Prometheus, and at some point, it reaches the limits of how much data the Prometheus agent can process. The most common failure mode is running out of memory due to the increased cardinality of the time series. When this happens, your Prometheus instances start dying because they need more memory, which means that you need to start scaling.
To analyze the solution in detail, we provide a dashboard with different charts that help us know when we have to scale our Prometheus solution.
There are two different scaling approaches for New Relic's Prometheus agent: vertical or horizontal.
Vertical Scaling
This kind of scaling comes without any complexity. It's as simple as updating the memory or the CPU for the corresponding machine where the cluster node is living.
However, this approach may not be scalable for big clusters, or we just don't want to have a single pod that consumes so many GBs of memory in our node. If so, you may need to use horizontal scaling.
Horizontal Scaling
Horizontal scaling, also known as sharding, is supported by setting up a configuration parameter which allows running several prometheus servers in agent mode to gather your data.
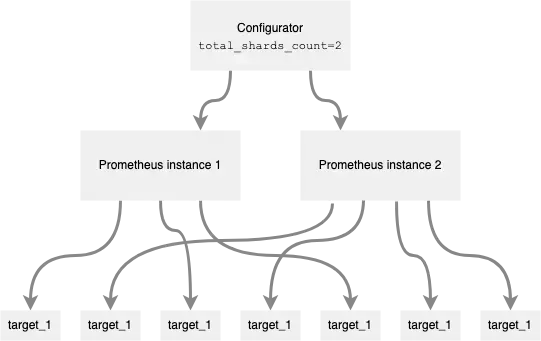
If you define the sharding.total_shards_count value, the deployed StatefulSet will include as many replicas as you define. When you use it, the configurator component automatically includes some additional relabel rules, so each target is only scraped by one prometheus server. Those rules rely on the target's address hash-mod.
To set the relabel rules for each target, the agent calculates a hash for the given target __address__ and then it applies the modulus to the hash, the modulus being the total number of shards. Then, it knows the shard the scraped target should be included into.
For example, if you include the following in the custom-values.yaml file:
# (...)sharding: total_shards_count: 2# (...)And then, you upgrade the release by running:
$helm upgrade my-prometheus-release newrelic-prometheus-configurator/newrelic-prometheus-agent -f custom-values.yamlThen, two prometheus servers will be executed and each target will only be scraped by one of them.
An example diagram would be the following:

Target scraper identification
The shard identification (name of the StatefulSet Pod) is added as a prometheus_server label to all metrics and you can use it to understand what Prometheus instance is scraping each target.
To uniquely identify a Prometheus server instance within an account, you should use a combination of the cluster_name and prometheus_server labels.
Self metrics
Prometheus server self-metrics should be gathered from all prometheus servers, so the additional rules when sharding is configured don't apply to the job gathering the prometheus self-metrics. This is possible because the agent accepts the skip_sharding flag in the static_target jobs. This parameter is already set in the default self-metrics job.
Limitations
If you include additional scrape jobs in the configuration as extra_scrape_configs, as that field holds the raw definition of prometheus jobs, the agent won't include the rules corresponding to sharding configuration and, as a result, the corresponding targets will be scrapped by all prometheus servers.
Currently, auto-scaling is not supported. To increase or decrease the number of shards, you need to update the chart settings, which restarts the prometheus pods.