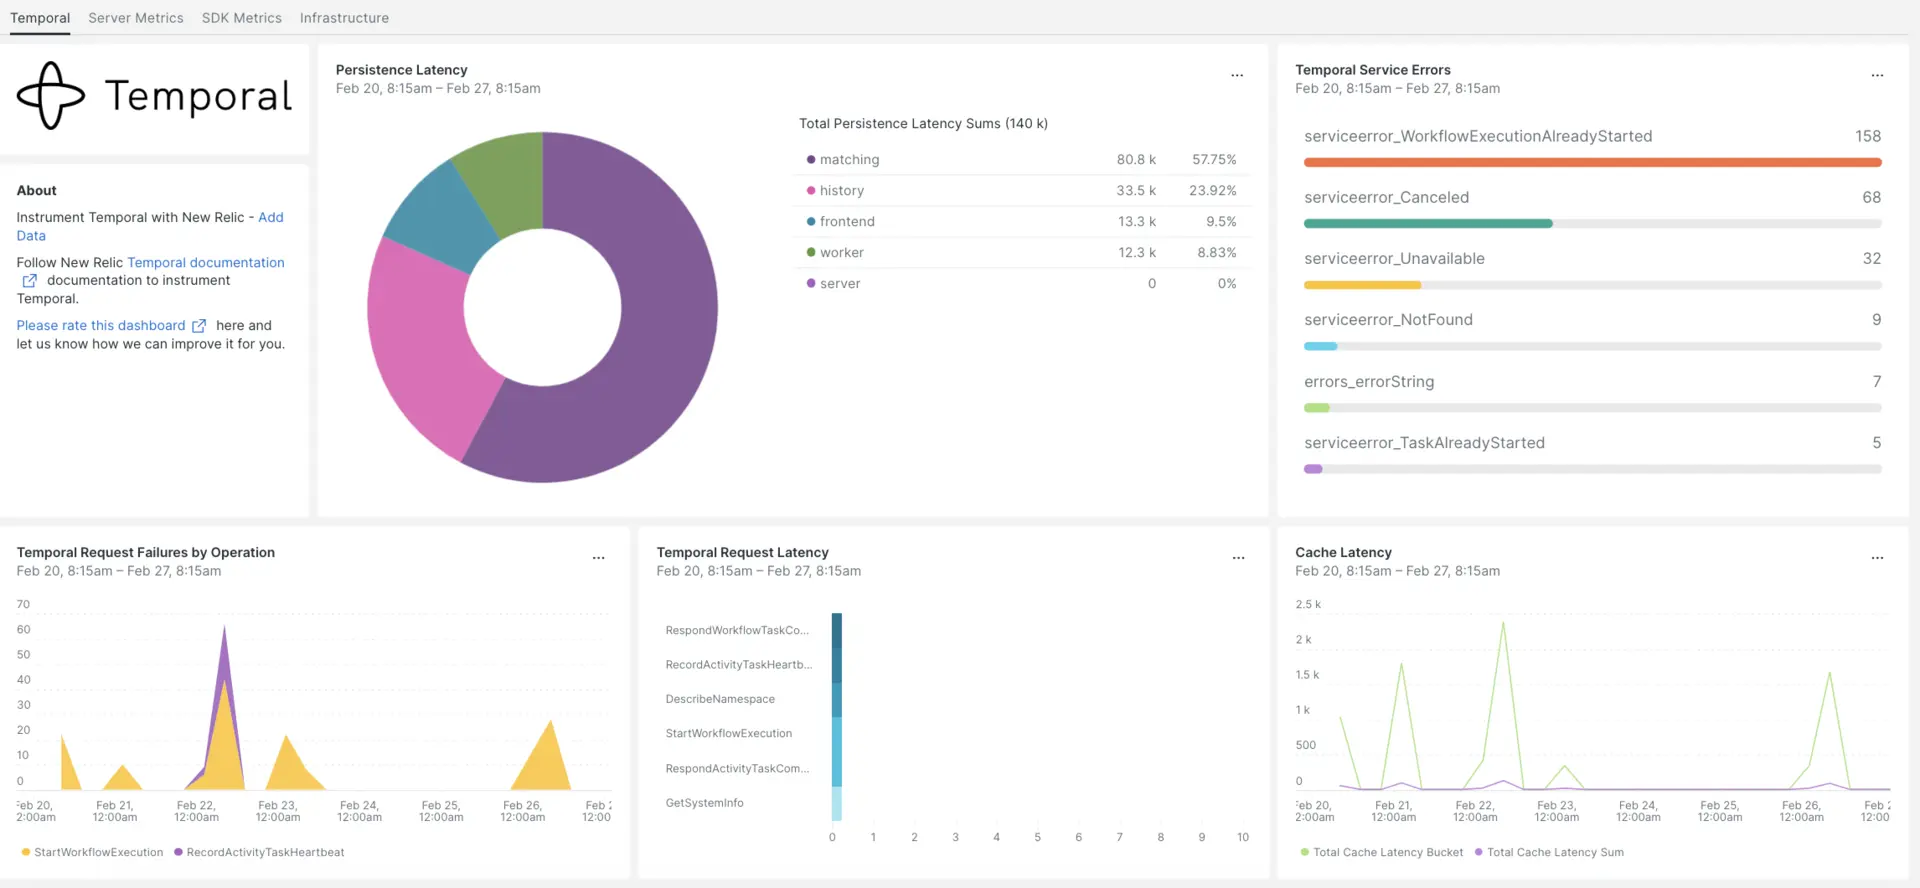
Our Temporal integration monitors the performance of your Temporal data, helping you diagnose issues in your write-distributed, fault-tolerant, and scalable applications. Our Temporal integration gives you a pre-built dashboard with your most important Temporal SDK app metrics.

After setting up the integration with New Relic, see your data in dashboards like these, right out of the box.
Install the infrastructure agent
To use the Temporal integration, you need to first install the infrastructure agent on the same host. The infrastructure agent monitors the host itself, while the integration you'll install in the next step extends your monitoring with Temporal-specific data such as database and instance metrics.
Expose Temporal metrics
The following steps will run a local instance of the Temporal Server using the default configuration file docker-compose.yml:
If you don't already have it, install
dockeranddocker-composeon your host:bash$sudo apt install docker$sudo apt install docker-composeClone the repository:
bash$git clone https://github.com/temporalio/docker-compose.gitChange directory into the root of the project:
bash$sudo nano docker-compose/docker-compose.ymlAdd the Prometheus endpoint and port to the
docker-compose.ymlfile.Environment:- PROMETHEUS_ENDPOINT=0.0.0.0:8000ports:- 8000:8000Run the
docker-compose upcommand to build your instance:bash$sudo docker-compose upConfirm your instance is running correctly on the following URLs:
- The Temporal server will be available on
localhost:7233. - The Temporal web UI will be available at
http://YOUR_DOMAIN:8080 - The Temporal server metrics will be available on the
http://YOUR_DOMAIN:8000/metrics
- The Temporal server will be available on
Expose Java SDK metrics
Now you'll expose SDK Client metrics that Prometheus will scrape:
Create a
MetricsWorker.javafile in your project main folder://...// You need to import the following packages to set up metrics in Java.// See the Developer's guide for packages required for the other SDKs.import com.sun.net.httpserver.HttpServer;import com.uber.m3.tally.RootScopeBuilder;import com.uber.m3.tally.Scope;import com.uber.m3.util.Duration;import com.uber.m3.util.ImmutableMap;// See the Micrometer documentation for configuration details on other supported monitoring systems.// This example shows how to set up the Prometheus registry and stats reported.PrometheusMeterRegistry registry = new PrometheusMeterRegistry(PrometheusConfig.DEFAULT);StatsReporter reporter = new MicrometerClientStatsReporter(registry);// set up a new scope, report every 10 secondsScope scope = new RootScopeBuilder().tags(ImmutableMap.of("workerCustomTag1","workerCustomTag1Value","workerCustomTag2","workerCustomTag2Value")).reporter(reporter).reportEvery(com.uber.m3.util.Duration.ofSeconds(10));// For Prometheus collection, expose the scrape endpoint at port 8077. See Micrometer documentation for details on starting the Prometheus scrape endpoint. For example,HttpServer scrapeEndpoint = MetricsUtils.startPrometheusScrapeEndpoint(registry, 8077); //note: MetricsUtils is a utility file with the scrape endpoint configuration. See Micrometer docs for details on this configuration.// Stopping the starter stops the HTTP server that exposes the scrape endpoint.//Runtime.getRuntime().addShutdownHook(new Thread(() -> scrapeEndpoint.stop(1)));//Create Workflow service stubs to connect to the Frontend Service.WorkflowServiceStubs service = WorkflowServiceStubs.newServiceStubs(WorkflowServiceStubsOptions.newBuilder().setMetricsScope(scope) //set the metrics scope for the WorkflowServiceStubs.build());//Create a Workflow service client, which can be used to start, signal, and query Workflow Executions.WorkflowClient yourClient = WorkflowClient.newInstance(service,WorkflowClientOptions.newBuilder().build());//...Go to your project directory and build your project:
bash$./gradlew buildStart the worker:
bash$./gradlew -q execute -PmainClass=<YOUR_METRICS_FILE>Check your worker metrics on the exposed Prometheus Scrape Endpoint:
http://YOUR_DOMAIN:8077/metrics.Note
For more information about the SDK metrics configuration, go through the Temporal official documentation.
Configure NRI-Prometheus
After a successful installation, make these NRI-Prometheus configurations:
Create file with named
nri-prometheus-temporal-config.ymlin this path:bash$cd /etc/newrelic-infra/integrations.d/Here's an example config file. Make sure to update the placeholder URLs:
integrations:- name: nri-prometheusconfig:standalone: false# Defaults to true. When standalone is set to `false`, `nri-prometheus` requires an infrastructure agent to send data.emitters: infra-sdk# When running with infrastructure agent emitters will have to include infra-sdkcluster_name: Temporal_Server_Metrics# Match the name of your cluster with the name seen in New Relic.targets:- description: Temporal_Server_Metricsurls: ["http://<YOUR_DOMAIN>:8000/metrics", "http://<YOUR_DOMAIN>:8077/metrics"]# tls_config:# ca_file_path: "/etc/etcd/etcd-client-ca.crt"# cert_file_path: "/etc/etcd/etcd-client.crt"# key_file_path: "/etc/etcd/etcd-client.key"verbose: false# Defaults to false. This determines whether or not the integration should run in verbose mode.audit: false# Defaults to false and does not include verbose mode. Audit mode logs the uncompressed data sent to New Relic and can lead to a high log volume.# scrape_timeout: "YOUR_TIMEOUT_DURATION"# `scrape_timeout` is not a mandatory configuration and defaults to 30s. The HTTP client timeout when fetching data from endpoints.scrape_duration: "5s"# worker_threads: 4# `worker_threads` is not a mandatory configuration and defaults to `4` for clusters with more than 400 endpoints. Slowly increase the worker thread until scrape time falls between the desired `scrape_duration`. Note: Increasing this value too much results in huge memory consumption if too many metrics are scraped at once.insecure_skip_verify: false# Defaults to false. Determins if the integration should skip TLS verification or not.timeout: 10s
Configure Temporal logs
To configure Temporal logs, follow the steps outlined below.
Run this Docker command to check the status of running containers:
bash$sudo docker psCopy the container ID for the temporalio/ui container and execute this command:
bash$sudo docker logs -f <container_id> &> /tmp/temporal.log &Afterwards, verify there is a log file named
temporal.loglocated in the/tmp/directory.
Forward logs to New Relic
You can use our log forwarding to forward Temporal logs to New Relic.
On Linux machines, make sure your log file named
logging.ymlis in this path:bash$cd /etc/newrelic-infra/logging.d/Once you find the log file in the above path, include this script in the
logging.ymlfile:logs:- name: temporal.logfile: /tmp/temporal.logattributes:logtype: temporal_logsUse our instructions to restart your infrastructure agent:
bash$sudo systemctl restart newrelic-infra.serviceWait a few minutes until data starts folowing into your New Relic account.
Find your data
You can choose our pre-built dashboard template named Temporal to monitor your Temporal metrics. Follow these steps to use our pre-built dashboard template:
From one.newrelic.com, go to the + Integrations & Agents page.
Click on Dashboards.
In the search bar, type Temporal.
When the Temporal dashboard appears, click to install it.
Your Temporal dashboard is considered a custom dashboard and can be found in the Dashboards UI. For docs on using and editing dashboards, see our dashboard docs.
Here is a NRQL query to check the Temporal request latency sum:
SELECT sum(temporal_request_latency_sum) FROM Metric WHERE scrapedTargetURL = 'http://<YOUR_DOMAIN>:8000/metrics'