Use New Relic to seamlessly monitor Open Cybersecurity Schema Framework (OCSF) data. You'll get comprehensive visibility into security-related data from multiple sources to facilitate threat detection, alert event response, and compliance.

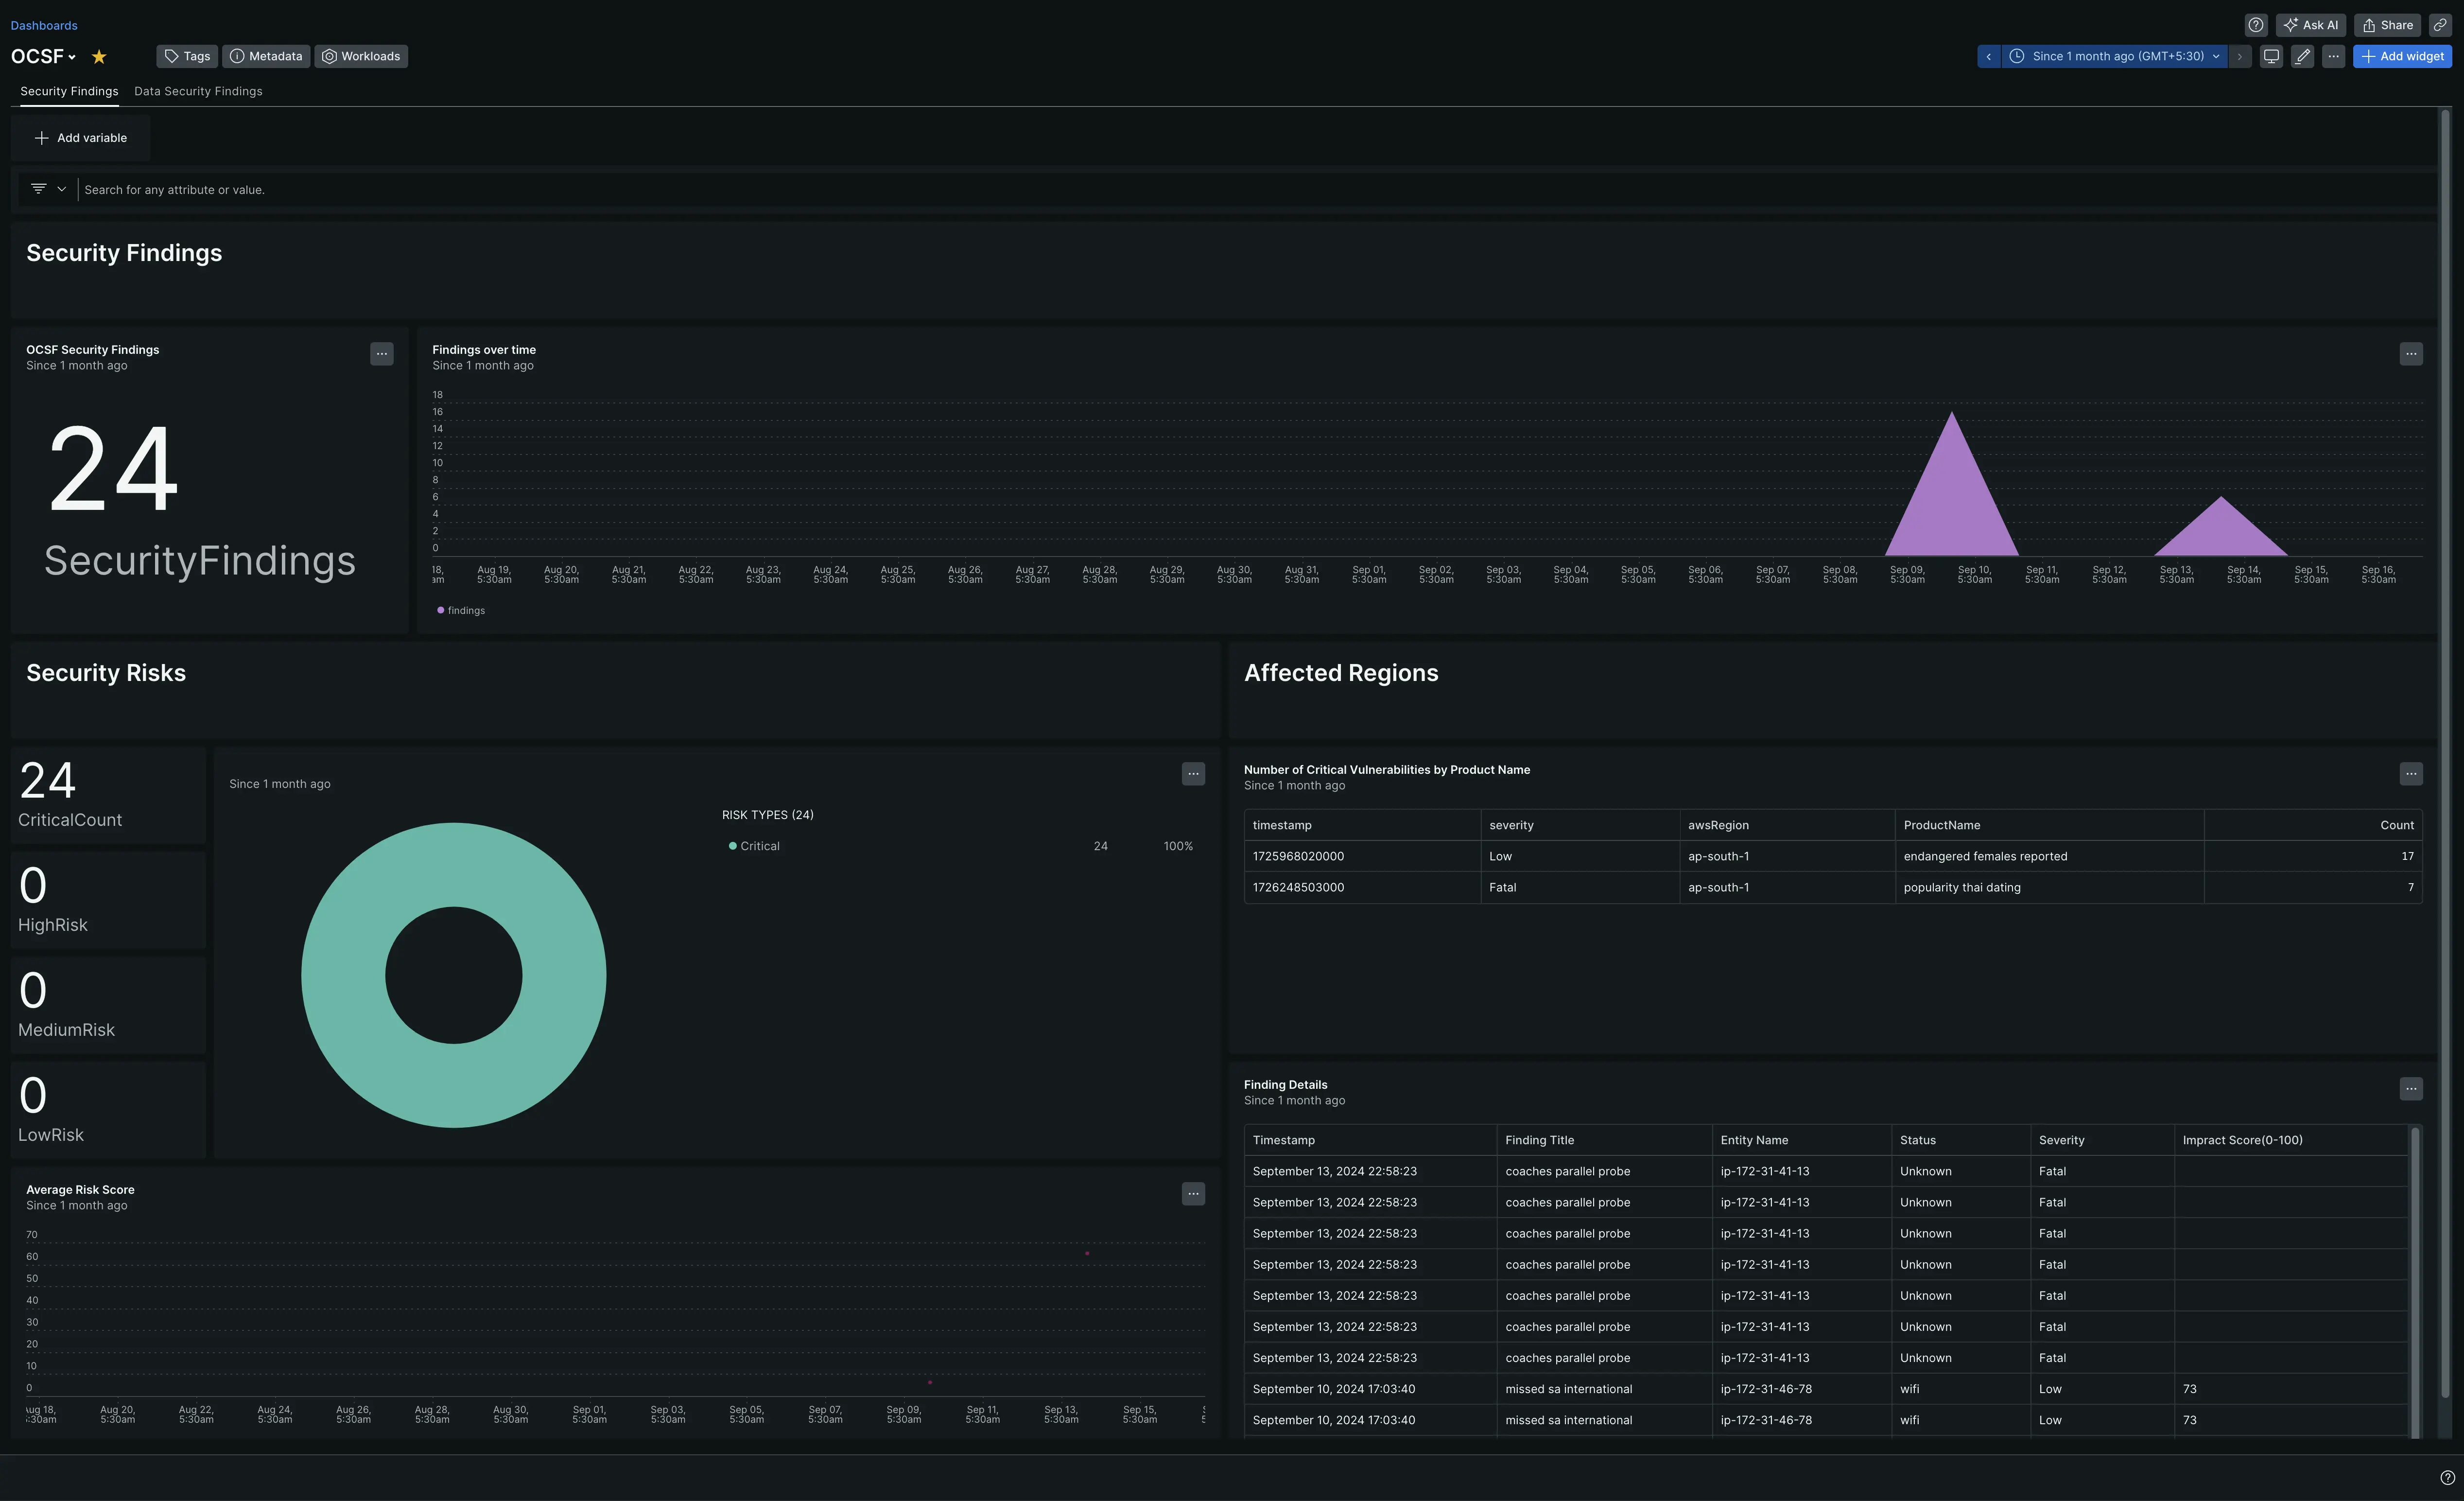
After setting up our OCSF integration, see your data in a dashboard right out of the box.
Set up the OCSF integration
Complete the following steps to set up the OCSF integration:
Install the infrastructure agent
To use the OCSF integration, you need to also install the infrastructure agent on the same host. The infrastructure agent monitors the host itself, while the integration you'll install in the next step extends your monitoring with OCSF-specific data.
Enable the OCSF integration with nri-flex
Create a file named
nri-ocsf.ymlin the integrations directory:bash$touch /etc/newrelic-infra/integrations.d/nri-ocsf.ymlAdd the following snippet to your
nri-ocsf.ymlfile to enable the agent to capture OCSF data:integrations:- name: nri-flexconfig:name: ocsfExampleglobal:base_url: http://ip-address:PORTheaders:accept: application/jsonapis:- event_type: ocsfSampleEvent # use this name to query the dataurl: /customEndpoint # endpoint with OCSF data- event_type: ocsfCustomEvent1url: /customEndpoint2
Restart the New Relic infrastructure agent
Use the instructions in our infrastructure agent docs to restart your infrastructure agent. This is command that should work for most people:
$sudo systemctl restart newrelic-infra.serviceFind your data
You can use our pre-built dashboard template to monitor your OCSF application metrics. Follow these steps to use our pre-built dashboard template:
Go to one.newrelic.com > All capabilities > + Integrations & Agents.
Select Dashboards to access the pre-built resources.
Search OCSF and select the dashboard.
To instrument the OCSF quickstart and to see metrics and alerts, you can also follow our OCSF quickstart page by clicking on the Install now button.
Here is an example NRQL query to view the OCSF master uptime:
SELECT * FROM ocsfSampleEventWhat's next?
To learn more about building NRQL queries and generating dashboards, check out these docs:
Introduction to the query builder to create basic and advanced queries.
Introduction to dashboards to customize your dashboard and carry out different actions.
Manage your dashboard to adjust your display mode, or to add more content to your dashboard.