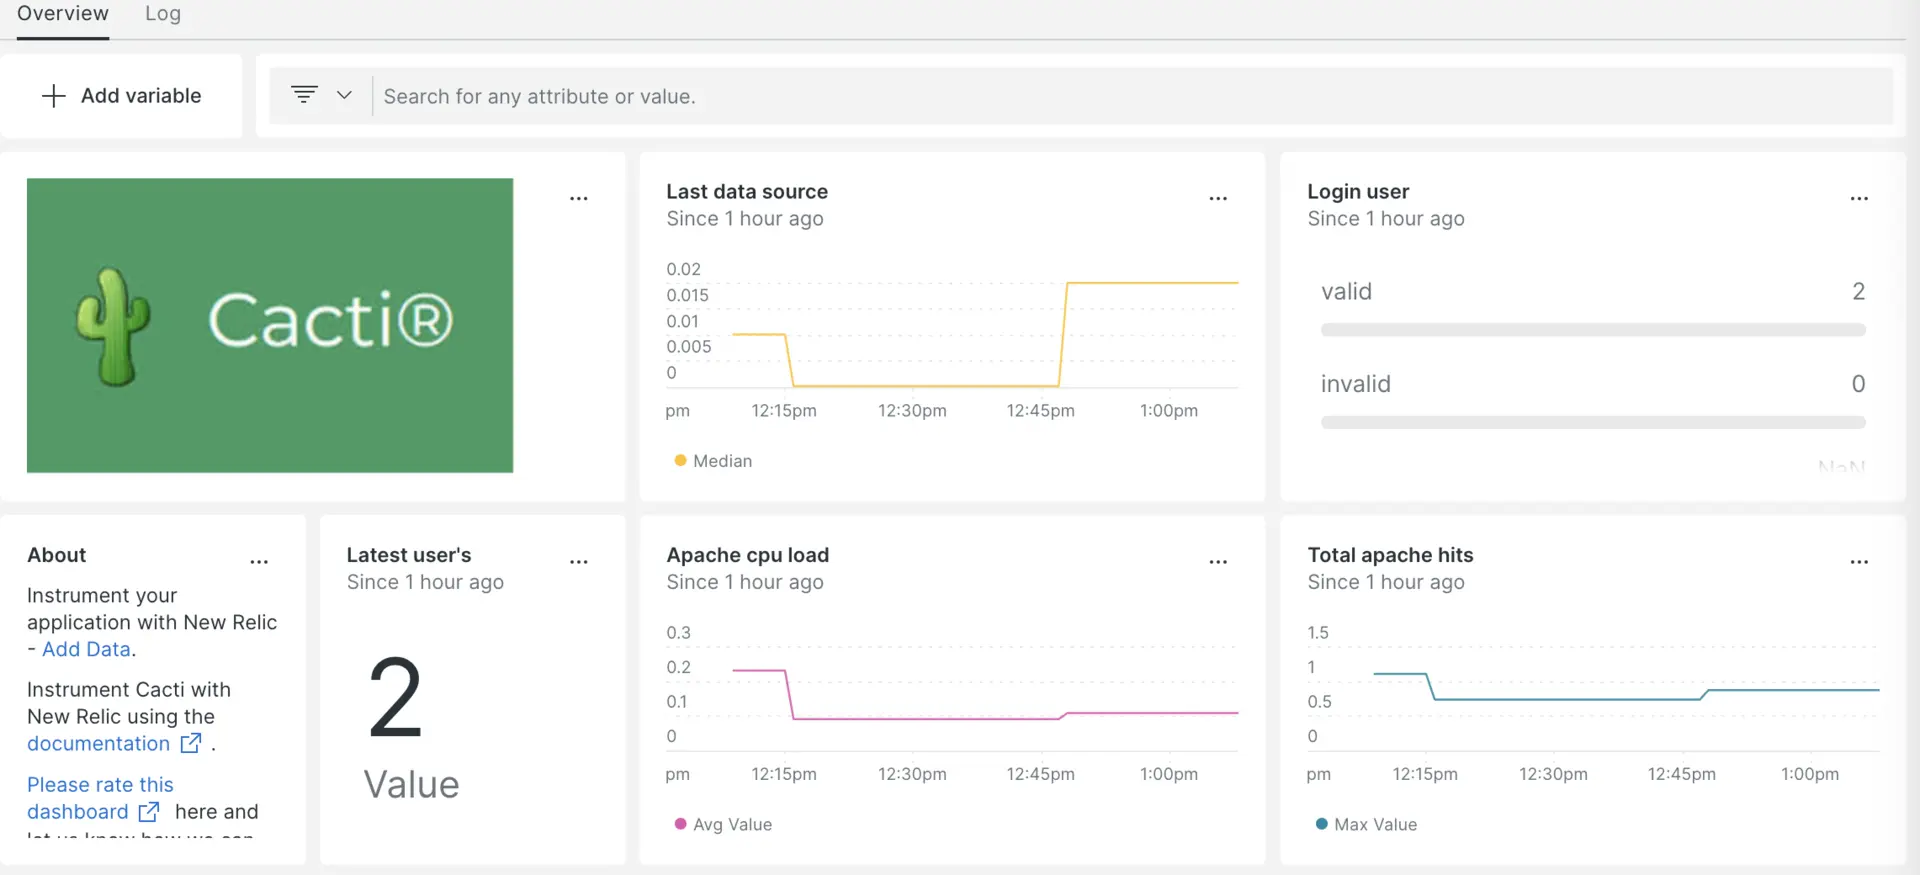
Integrating Cacti with New Relic provides you with a user-friendly, graphical representation of your RRD data, all within New Relic's unified platform.

You can see your data in a dashboard after setting up the Cacti integration with New Relic.
Set up the Cacti integration
Complete the following steps to set up the Cacti integration:
Install the infrastructure agent
To use the Cacti integration, you need to first install the infrastructure agent on the same host.
Expose Cacti metrics
Complete the steps below to expose your RRD data in either a CSV or JSON format:
- Export data from Cacti's RRD files into the
XML formatusing RRDTool. - Convert the XML data into a
CSV or JSONformat.
Use NRI-Flex to capture CSV format metrics
Flex comes bundled with the New Relic infrastructure agent. You need to configure NRI-Flex for Cacti and create a flex configuration file. Follow these steps:
Create a file named
cacti-config.ymlin the/newrelic-infra/integrations.dpath.Update the
cacti-config.ymlwith the following configuration example:---integrations:- name: nri-flexconfig:name: machineLoadapis:- name: machineLoadfile: /home/ubuntu/xmlToCsv/local_linux_machine_load_1min_2.csv- name: memSwapfile: /home/ubuntu/xmlToCsv/local_linux_machine_mem_swap_5.csv- name: procfile: /home/ubuntu/xmlToCsv/local_linux_machine_proc_1.csv- name: machineUserfile: /home/ubuntu/xmlToCsv/local_linux_machine_users_3.csv- name: memBuffersfile: /home/ubuntu/xmlToCsv/local_linux_machine_mem_buffers_4.csv- name: ApacheCpuLoadfile: /home/ubuntu/xmlToCsv/local_linux_machine_apache_cpuload_6.csv- name: ApacheTotalHitsfile: /home/ubuntu/xmlToCsv/local_linux_machine_apache_total_hits_7.csv- name: ApacheTotalKbytesfile: /home/ubuntu/xmlToCsv/local_linux_machine_apache_total_kbytes_8.csv- name: UserLoginsfile: /home/ubuntu/xmlToCsv/local_linux_machine_active_10.csv
Forward Cacti logs
Follow these steps to forward Cacti logs to New Relic:
Edit the log file named
logging.ymllocated at the following path:bash$cd /etc/newrelic-infra/logging.dAdd the following snippet to the
logging.ymlfile. Replacefilewith your Cacti log file path if needed:logs:- name: cacti.logfile: /var/www/html/cacti/log/LOG_FILE_NAMEattributes:logtype: cacti_log
Restart the New Relic infrastructure agent
Restart your infrastructure agent:
$sudo systemctl restart newrelic-infra.serviceYour application will send metrics to one.newrelic.com in a few minutes.
Find your data
You can use our pre-built dashboard template to monitor your Cacti application metrics. Follow these steps to use our pre-built dashboard template:
From one.newrelic.com, go to the + Integrations & Agents page
Click on Dashboards
In the search bar, type
CactiThe Cacti dashboard should appear. Click on it to install it
Your Cacti dashboard is considered a custom dashboard and can be found in the Dashboards UI. For docs on using and editing dashboards, see our dashboard docs.
Here is an example NRQL query to view the count of the user login :
SELECT latest(value) FROM UserLoginsSample FACET name
What's next?
To learn more about building NRQL queries and generating dashboards, check out these docs:
- Introduction to the query builder to create basic and advanced queries.
- Introduction to dashboards to customize your dashboard and carry out different actions.
- Manage your dashboard to adjust your dashboard display mode or add more content.