To ensure our systems are always up and ready to support you, and to keep you from unintended use, we place limits on the amount of data you can send, query, and store.
Limits UI
To find the limits UI: from the user menu, click Manage your data and click Limits.
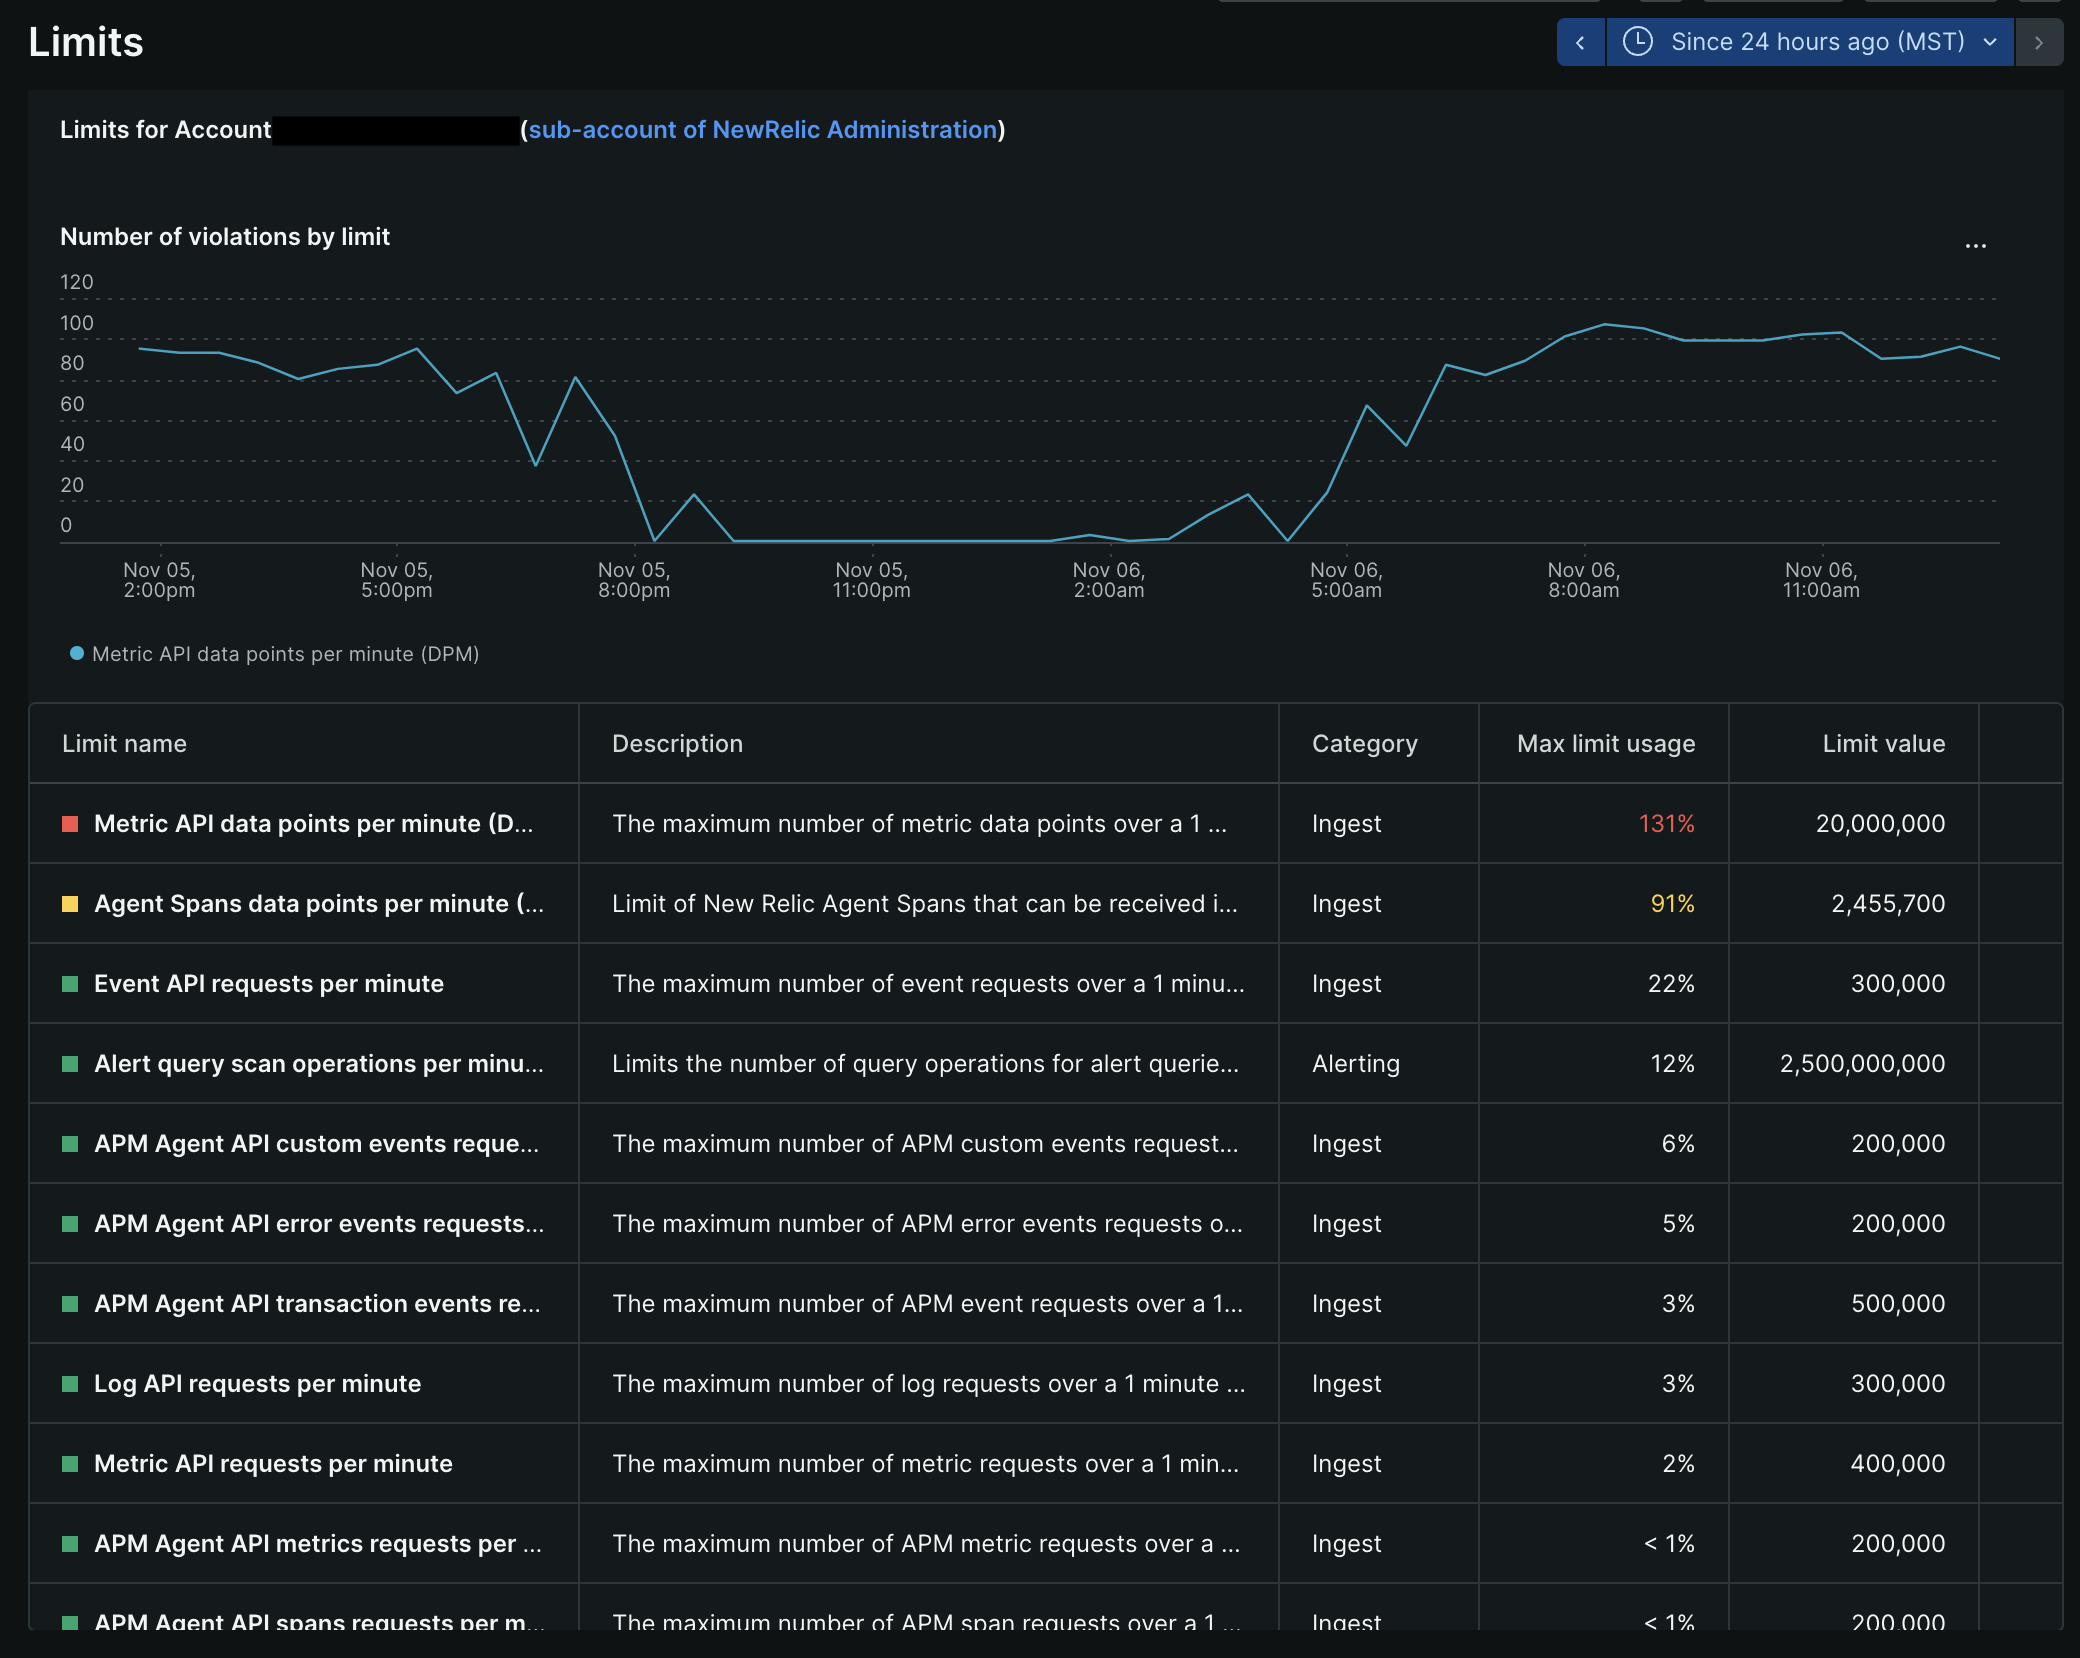
This UI displays information about how close an account is to hitting rate limits (both data ingest-related limits and query limits), and incidents of those limits. The data displayed here is generated from:
- Resource use metrics
- Limit incidents reported in
NrIntegrationErrorevents

The limits UI displays information related to an account's data ingest rate and query rate, and incidents of limits.
What the color-coding in the incident table means:
- Red: exceeded a limit
- Yellow: 80-100% of a limit
- Green: below 80%
- Gray: limits that don't have reported usage or incidents for the given time range
Some tips on using the limits UI:
- To get more detail about a table entry, try clicking it. Some entries have more detail, including associated NRQL queries.
- When you select a time range greater than six hours, the chart uses average values, which may smooth out spikes. This is the reason you may see the message "For the time window chosen, the 'Max limit usage' value represents the average of your usage limits." To see more accurate results, use a time range of 24 hours.
- It's possible for the use of a resource to be over a limit while not generating an incident. For example, query limit events are generated for a one-minute level, but incidents are only generated for continually exceeding that limit at the 5-minute level.
If you want more detail than the UI provides, see Query your resource use.
Responses to limit incidents
Limits are enforced per account (not per organization). You might reach a limit if you start monitoring a new high-traffic application, or have a sudden data spike. When you do reach a limit, New Relic responds according to the type of data and the limit that's reached. Some examples of responses:
- We place a limit on the number of ingested requests per minute (RPM) per data type. When this limit is reached, we stop accepting data and return a 429 status code for the duration of the minute.
- For queries, we place limits on the number of queries per minute and the number of records inspected (see NRQL query rate limits).
- For metrics, we place a limit on the number of unique time series (cardinality) per account and per metric. When this limit is reached, aggregated data is turned off for the rest of the UTC day.
For every major limit incident, New Relic creates an NrIntegrationError event for that account, which has these limit-related attributes:
Attribute | Description |
|
|
| The name of the limit. |
| Describes the limit and the impact. |
limitValue | The limit reached. |
Account-level limits
This table includes general max limits that apply across all New Relic accounts. Specific New Relic tools, like agents and integrations, have their own limits and configurations, and those limits will sometimes be lower than these theoretical account-level maximum limits.
Limited condition | Limit |
|---|---|
Rate of NRDB record* ingest | 55 million per account per minute |
Max NRDB records* ingested per API call | 1MB (10^6 bytes) |
Max attribute value size | 1KB (10^3 bytes) |
Max attribute name length | 255 characters |
Max attribute value length | Metric, Trace, and Event API: 4096 characters. Log API: 4094 characters. |
Max payload size | 1MB (10^6 bytes) |
Max total attributes per data type (including default attributes) | 254 (less for some tools; for example, 64 for agents) |
Number of unique custom data types per account per namespace per day | 250 (primarily a limit for custom events) |
APM limits |
|
Browser: number of page views | 1M per minute per app |
Rate of metric timeslice data (used by APM, browser, ) |
|
Distributed tracing | See Trace limits. |
Infrastructure agents, integrations |
|
Mobile monitoring: number of crashes reported | 10K per hour |
Synthetic monitors | See synthetics limits. |
Query limits | |
Alert query limits |
* NRDB records refers to database records for our core data types, which includes events, metrics (dimensional), logs, and distributed tracing (span) data, all stored in the New Relic database (NRDB). This does not include metric timeslice data.
Data ingest API limits
Our ingest APIs have additional limits that may override the more general account-level limits. Note that these limits also apply for our tools that use these APIs.
- Metric API (dimensional metrics)
- Event API
- Log API
- Trace API
NerdGraph API limits
Finding other agent and integration limits
To find limits for our other agents and integrations, which will override more general account-level limits, see the docs for those tools: you can search our quickstarts here. Some default reporting limits are located in these tools' configuration docs.