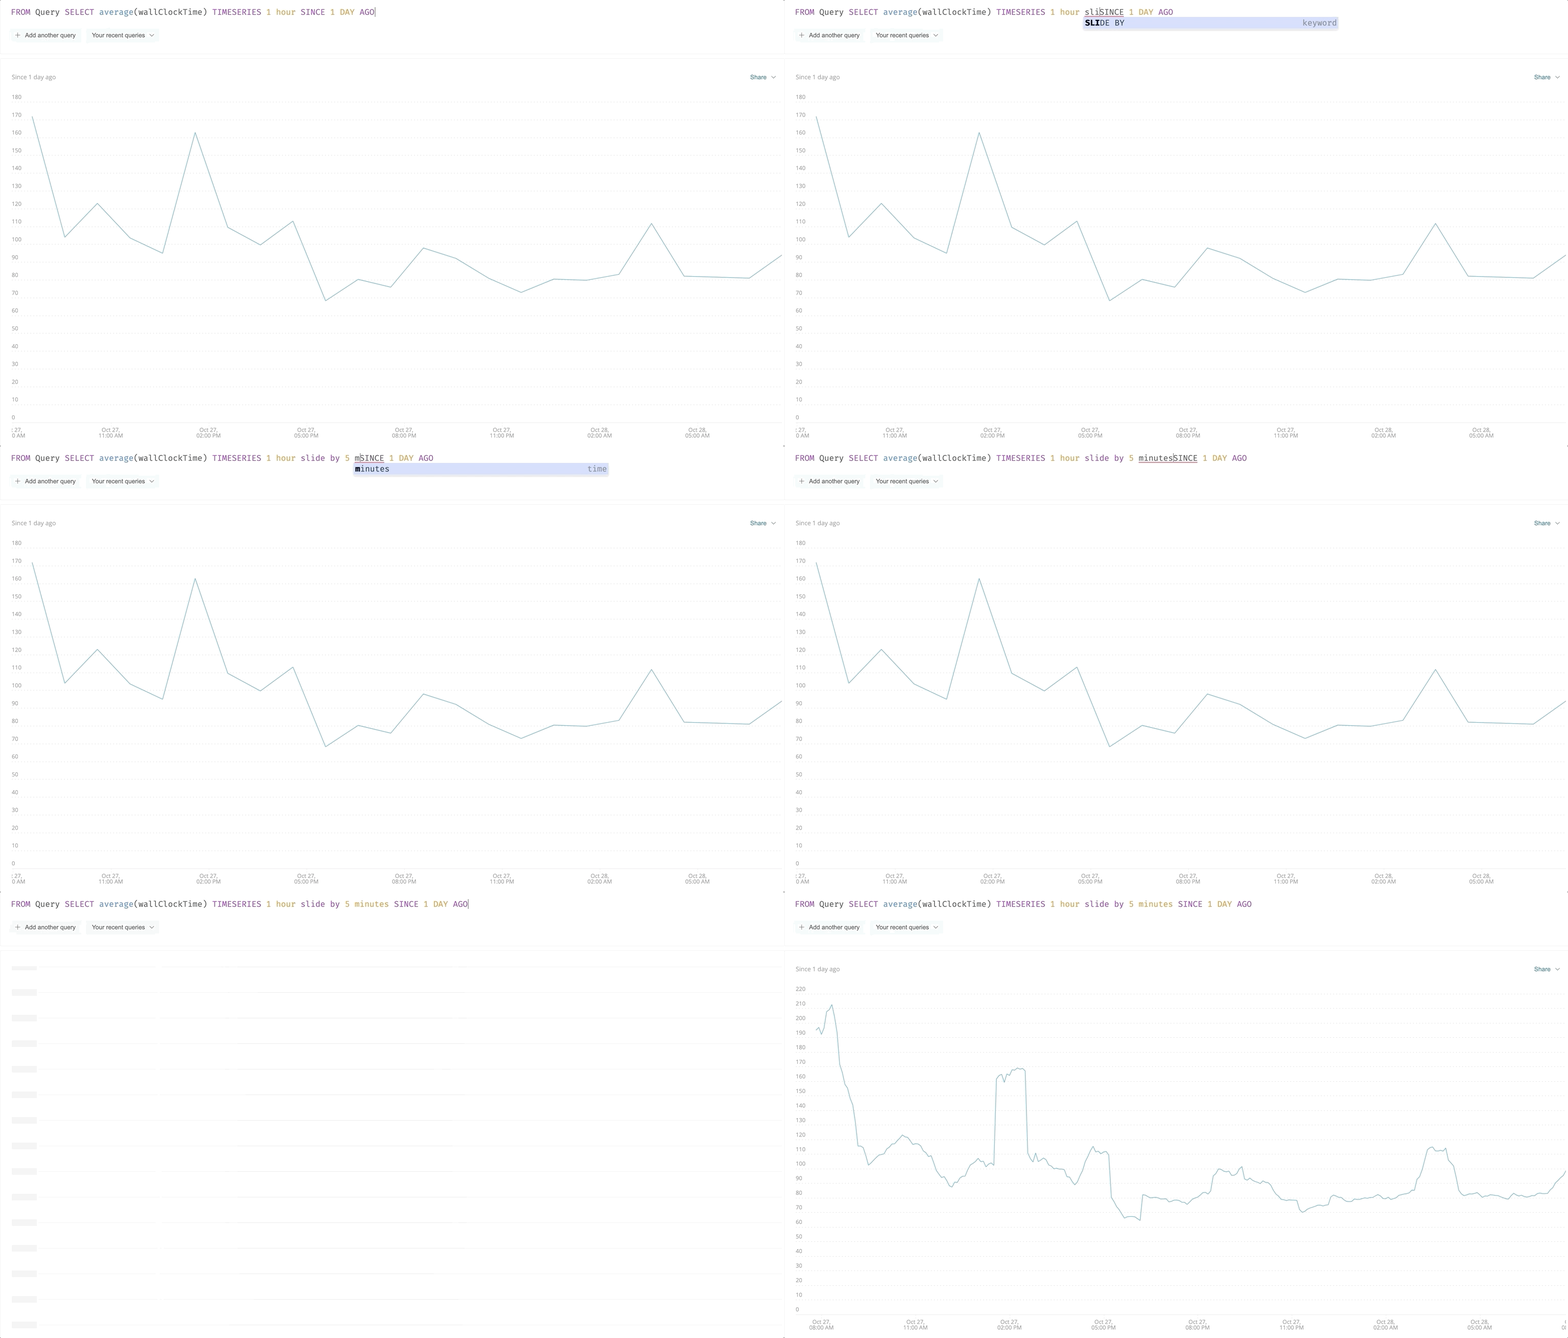
Sliding windows enable you to increase chart resolution without losing the intent of the result by reducing the timeseries aggregate size, as shown below. Highly variable results can also be smoothed out by increasing the aggregate size, without losing resolution.
Sliding windows generate charts using the SLIDE BY clause in conjunction with the TIMESERIES clause. With sliding windows, data is gathered in time "windows" that overlap with each other. The first duration associated with TIMESERIES defines the size of the aggregation windows, which defines how many results are captured per window. The second duration associated with SLIDE BY, defines the step size between each aggregation, which then defines the charts resolution.

NRQL syntax follows the following format:
SELECT ... TIMESERIES integer1 units SLIDE BY integer2 units
PromQL-style queries are translated into NRQL sliding window queries. For example, rate(request_count[5m]) over the past 60 minutes with a 1-minute window overlap would be translated into the NRQL query below:
SELECT rate(sum(request_count), 1 SECONDS) FROM Metric SINCE 3600 SECONDS AGO UNTIL NOW FACET dimensions() LIMIT 100 TIMESERIES 300000 SLIDE BY 60000