Your infrastructure requires regular inspection and maintenance. Like a city planner designing a new road or bridge, decisions about what your system needs should come from careful observation about existing limitations. For cities, this looks like adding new lanes to major thoroughfares when traffic congestion increases in the morning or evening. For a tech stack, this looks like a series of resource decisions that affect the performance of your APIs, services, and apps.
With our infrastructure agent, you can regularly collect metrics and event data so you know if your infrastructure is scaling appropriately. What processes affect CPU and disk usage? How does an app behave just before a CPU spike? Are your hosts reacting to a database failure? How quickly you can answer these questions is the difference between an outright outage, a minor incident, or a smooth autoscale.

Objectives
This tutorial series walks you through using infrastructure data to troubleshoot different incident scenarios. While New Relic offers a full suite integrations to monitor the cloud, containerized environments, and various virtual machines, this series is specific to data reported with an infrastructure agent that does not have additional integrations.
That said, this doc explains how you might fully instrument your system. You will:
- Install the infrastructure agent with our guided install
- Understand the guided install's recommendations so you can make an informed decision about instrumentation
- Learn about infrastructure integrations
Install the infrastructure agent
When you install the infrastructure agent, you're installing a piece of software that can integrate to any number of technologies. The agent collects the data it has access to, then reports that data to New Relic, where you can explore it via our UI. Monitoring your infrastructure lets you respond to incidents with more clarity and direction, so you can move from reaction to proaction in your incident response.
Start with our guided install
To install the infrastructure agent, we recommend using our guided install. Our guided install is a CLI installer that lets New Relic inspect, then make recommendations about additional instrumentation to your system. These recommendations are for our agents and any integrations relevant to your system.
Instrument your system with agents
The fidelity of your data largely depends on what you've chosen to report to New Relic. It's the difference between purchasing a point-and-shoot camera that may capture the essence of a scene without the detail, or a professional DSLR camera that brings a scene back to life.
When we recommend that you fully instrument your system, we mean that you install an agent or integration that can capture data on any server, cloud host, virtual machine, service, or app. When the guided install makes recommendations to you, it's letting you know that there's an agent (or integration) available to capture data for that potential source.
Let's take an example of a system and what the guided install might recommend:
An example system uses... | The guided install recommends... |
|---|---|
A Windows, MacOS, or Linux operating system to run its hosts | The infrastructure agent |
...and Java virtual machines | The JMX integration |
...and Azure virtual machines | The Microsoft Azure cloud integration |
...and a few Springboot apps | The Java APM agent |
...and microservices written in Ruby and Go | The Ruby and Go APM agents |
The guided install, then, would recommend:
- The infrastructure agent with two additional integrations for Azure and Java virtual machines
- The Java, Ruby, and Go agents for your apps
View your infra data
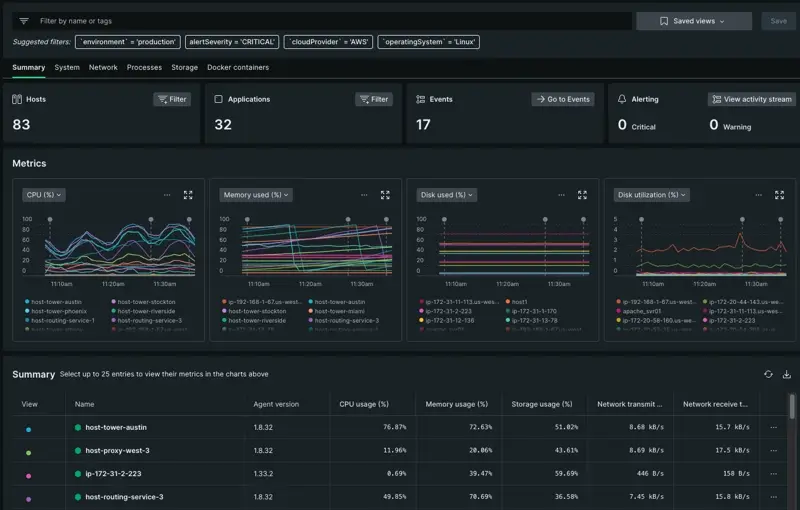
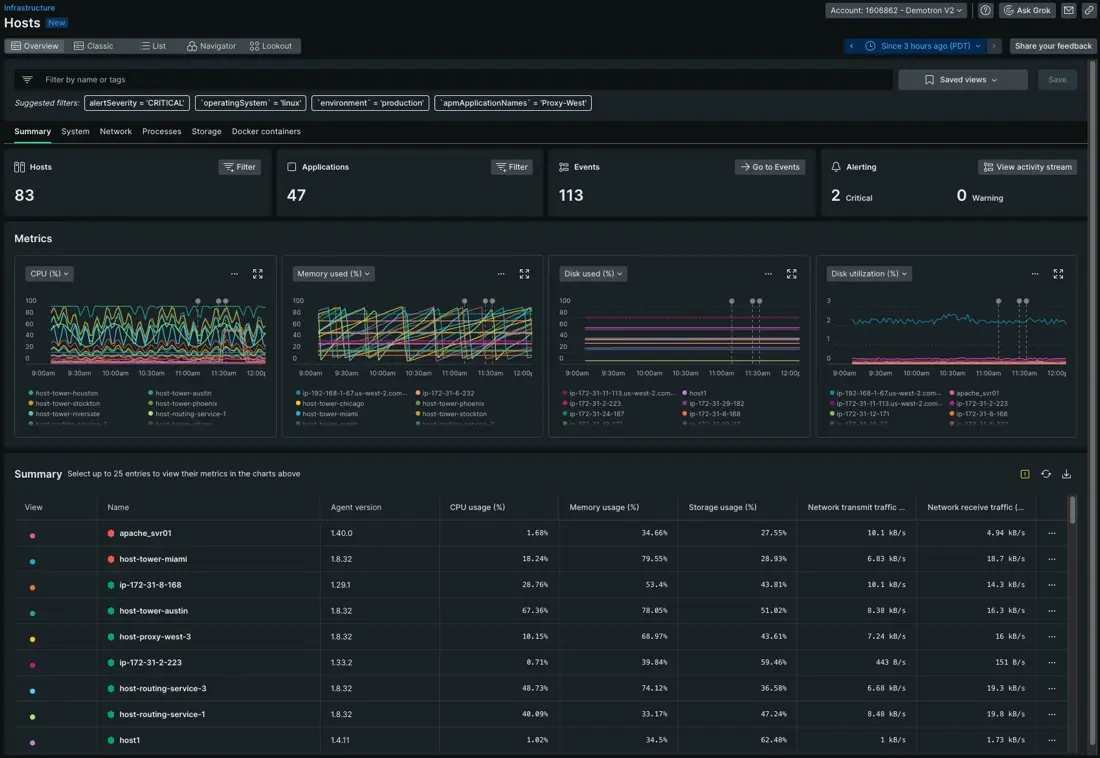
Once installed, you can find your infrastructure data in our UI. Go to one.newrelic.com > All Capabilities > Infrastructure. You're now looking at a summary page about your instrumented hosts.

Each host page has a filter bar, metric graphs, and a summary table. The data represents changes in your golden metrics over time—that is, changes in host CPU usage, memory usage, disk usage, and disk utilization.
How do agents and integrations relate to each other?
Once you've installed the infrastructure agent, you can integrate it with your cloud provider, flavor of virtual machine, or container orchestration by way of integration. Integrations let you customize how the infrastructure agent is enabled so you're only installing what you need. For example, if you use Microsoft Azure but not AWS, then you can ignore the AWS integration and instead only install the Microsoft Azure integration.
If you opted out of an installation with our guided install but since changed your mind, you can check out our integration offerings at our Introduction to infrastructure integrations doc.