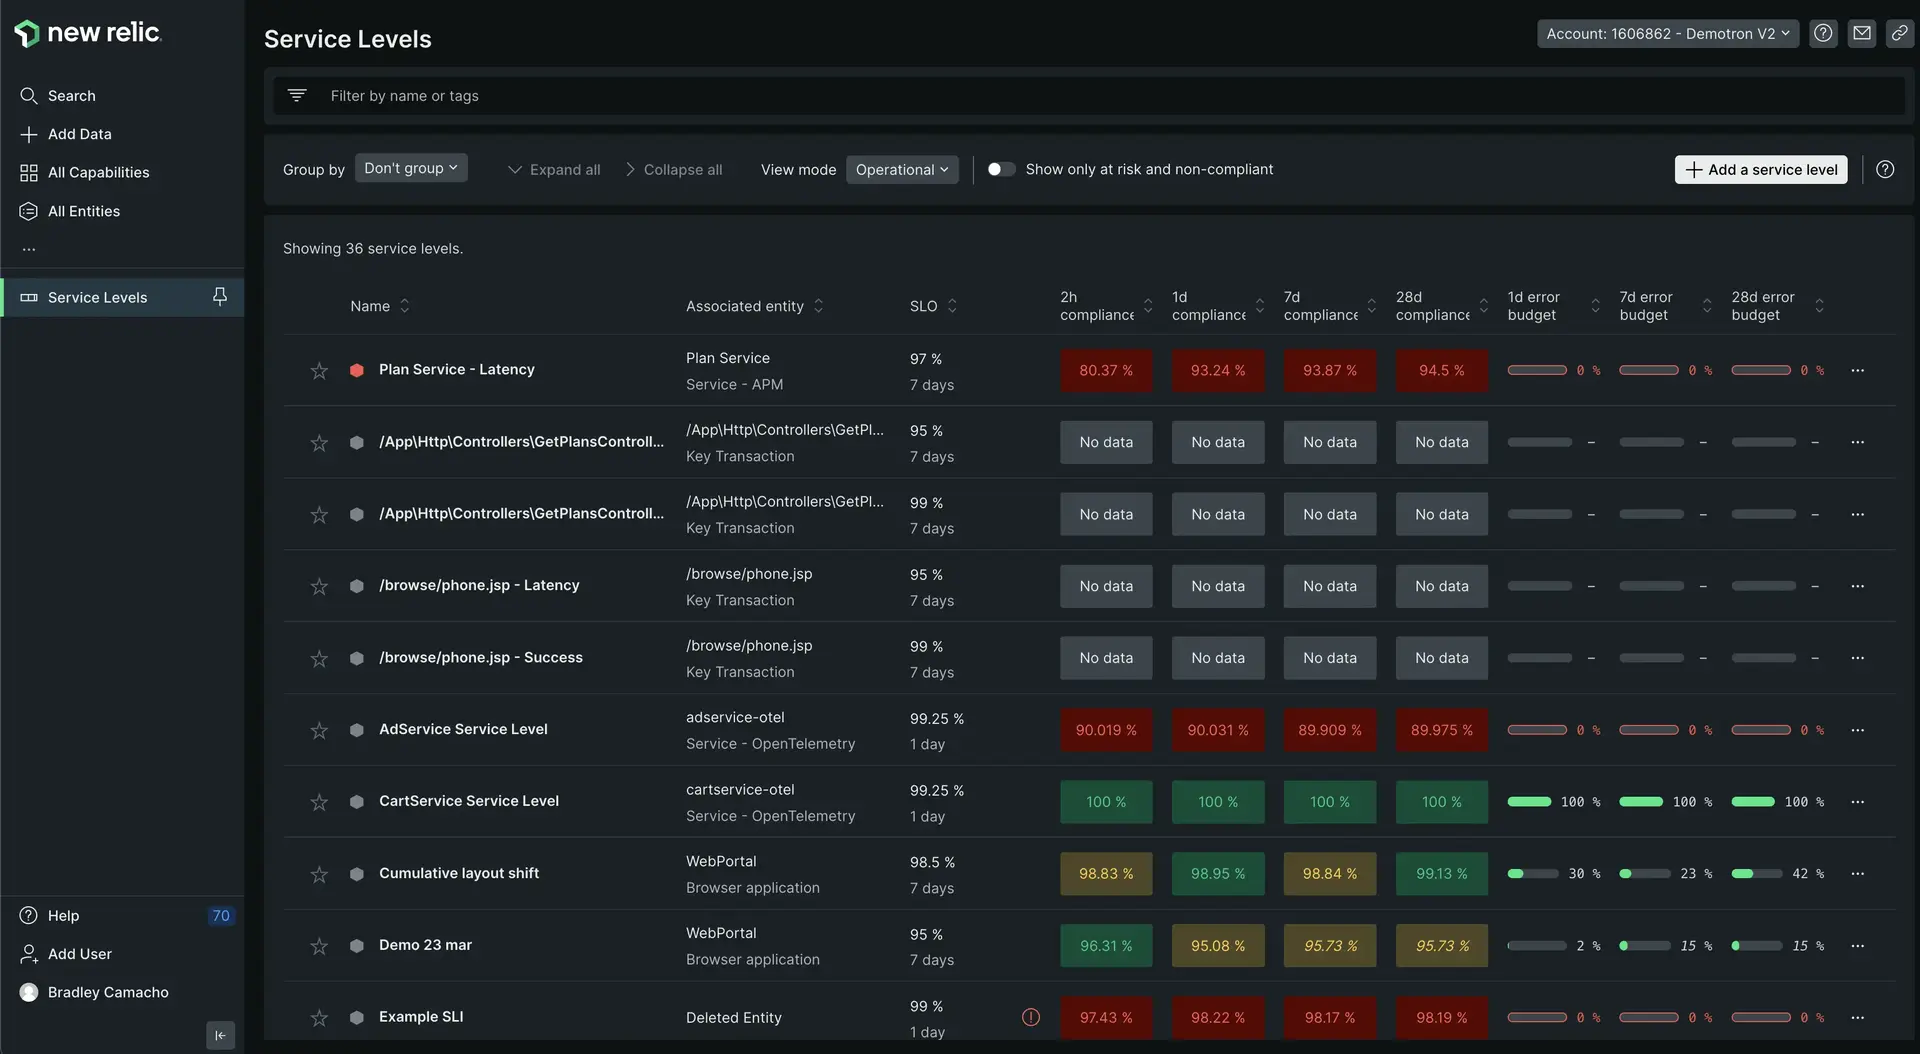
Your system architecture is made up of hosts, apps, and services that affect and depend on each other. If one part of your architecture underperforms, it can later lead to critical system outages. Service levels, however, let you apply thresholds that make keeping track of your system easier. If performance on a service exceeds or falls below a given threshold, you receive an alert. Here are the layers to service levels:
- A service level is made up of service level objectives (SLOs). SLOs are goals that represent how you expect your services to behave.
- Your SLOs are defined by service level indicators (SLIs). SLIs are key measurements and metrics that determine service availability.
- On top of these objectives an indicators are alerts. These notify you when your services fail to meet your SLOs.
Objectives
This tutorial walks you through creating performance benchmarks with service levels. By the end of the tutorial, you'll have these tasks completed:
- Understand the relationship between service level indicators (SLIs) and service level obectives (SLOs).
- Create and defined SLIs and SLOs for your frontend experience.
- Set up alerts so you know when your services have a drop in performance.
Define your service levels
Defining and managing your service levels following the steps below provides the ability to:
- Ease future setup: Automatically establish a baseline of performance and reliability for any service with a one-click setup.
- Define reliability across teams: Avoid arduous alignment processes with SLO and SLI recommendations that help you determine service boundaries. Set reliability benchmarks automatically based on recent performance metrics in any entity.
- Iterate and improve: With full-stack context and automation through open-source infrastructure-as-code tools like Terraform, teams have insight into how specific nodes or services impact system reliability and can quickly take control over their performance. Custom views for both service owners and business leaders drive operational efficiency and lead to better reporting, alerting, and incident management processes.
- Standardize reliability: Cross-organizational teams have a unified, transparent view of service reliability, and can better comply with customer-facing SLAs. SLO compliance metrics and error budgets give organizations a way to report on reliability and implement changes across applications, infrastructure, and teams in a cohesive fashion.
Create your performance benchmarks
Select service level indicators:
While there are a large amount of SLIs you could use to define your frontend experience benchmarks, the following are some we specifically reccomend. Each collapser has an explanation of when you should choose that SLI and a corresponding NRQL query (which you'll use in step 2).
For now, just select one of the following:
SLIs for APM services instrumented with the New Relic agent:
Based on Transaction events, these SLIs are the most common for request-driven services:
SLIs for browser applications: The following SLIs are based on Google's core web vitals.
Sugerencia
Your organization should define SLOs and SLIs based on your specific needs, your user's expectations, and resources available. After completing this tutorial, we recommend you learn more about how to define granular custom service levels.

- Navigate to one.newrelic.com > All capabilities > Service levels management. This UI shows all your service levels and allows you to define, monitor, and edit them.
- Select + Add a service level in the top right of the UI.
Choose the corresponding entity that you want to create a service level for. This could be an entire workload, a specific service, a synthetic monitor, or even a specific transaction. Once you've selected your entity, click Continue on the left side of the UI pane.
Define the SLI you chose in step one in this pane. For example if you chose to define an SLI for browser app success, you would use the following queries:
Query for valid events:
FROM: PageViewWHERE: entityGuid = '{entityGuid}'Query for bad events:
FROM: JavaScriptErrorWHERE: entityGuid = '{entityGuid}' AND firstErrorInSession IS trueSelect Continue in the left pane once you've confirmed your queries are correct.
What's next?
Congratulations! You've completed our journey on how to use New Relic to improve your site's performance! In this tutorial, you learned a few things about improving your site performance. You learned how to:
- Unlock data that can give you insight into how your site currently performs by instrumenting your site.
- Evaluate your core web vitals so you can make the right decisions about improving end-user experience.
- Make improvements to your site by fixing high latency and reducing JavaScript errors
- Create performance benchmarks to track performance over time.
New Relic offers other capabilities that can help you improve performance. While this tutorial focused on your site, you can check out our other tutorials:
- Is your app slow? Check out My app is slow to troubleshoot and fix common issues with your apps.
- Is your infrastructure instrumented, but you don't know how to grok your host data? Check out our Troubleshoot hosts with infra data tutorial.
- Do you need alerts, but don't know where to start? Check out our Create and manage alerts tutorial.