• /
  • EnglishEspañol日本語한국어Português
  • Inicia sesiónComenzar ahora

View ping monitor results

Synthetic monitoring automatically records all ping monitor checks, allowing you to see the load time and response size for every run.

Use the explorer and the selected ping monitor's Summary and Results pages to:

  • Select a resource to view load timing, response and request headers, and other details.
  • Use these details to find problems and diagnose performance issues.

Sugerencia

For information on simple or scripted monitors, see View simple or scripted monitor results.

View ping monitor results

To access a complete list of ping monitor results:

  1. Go to one.newrelic.com > Synthetic monitoring.
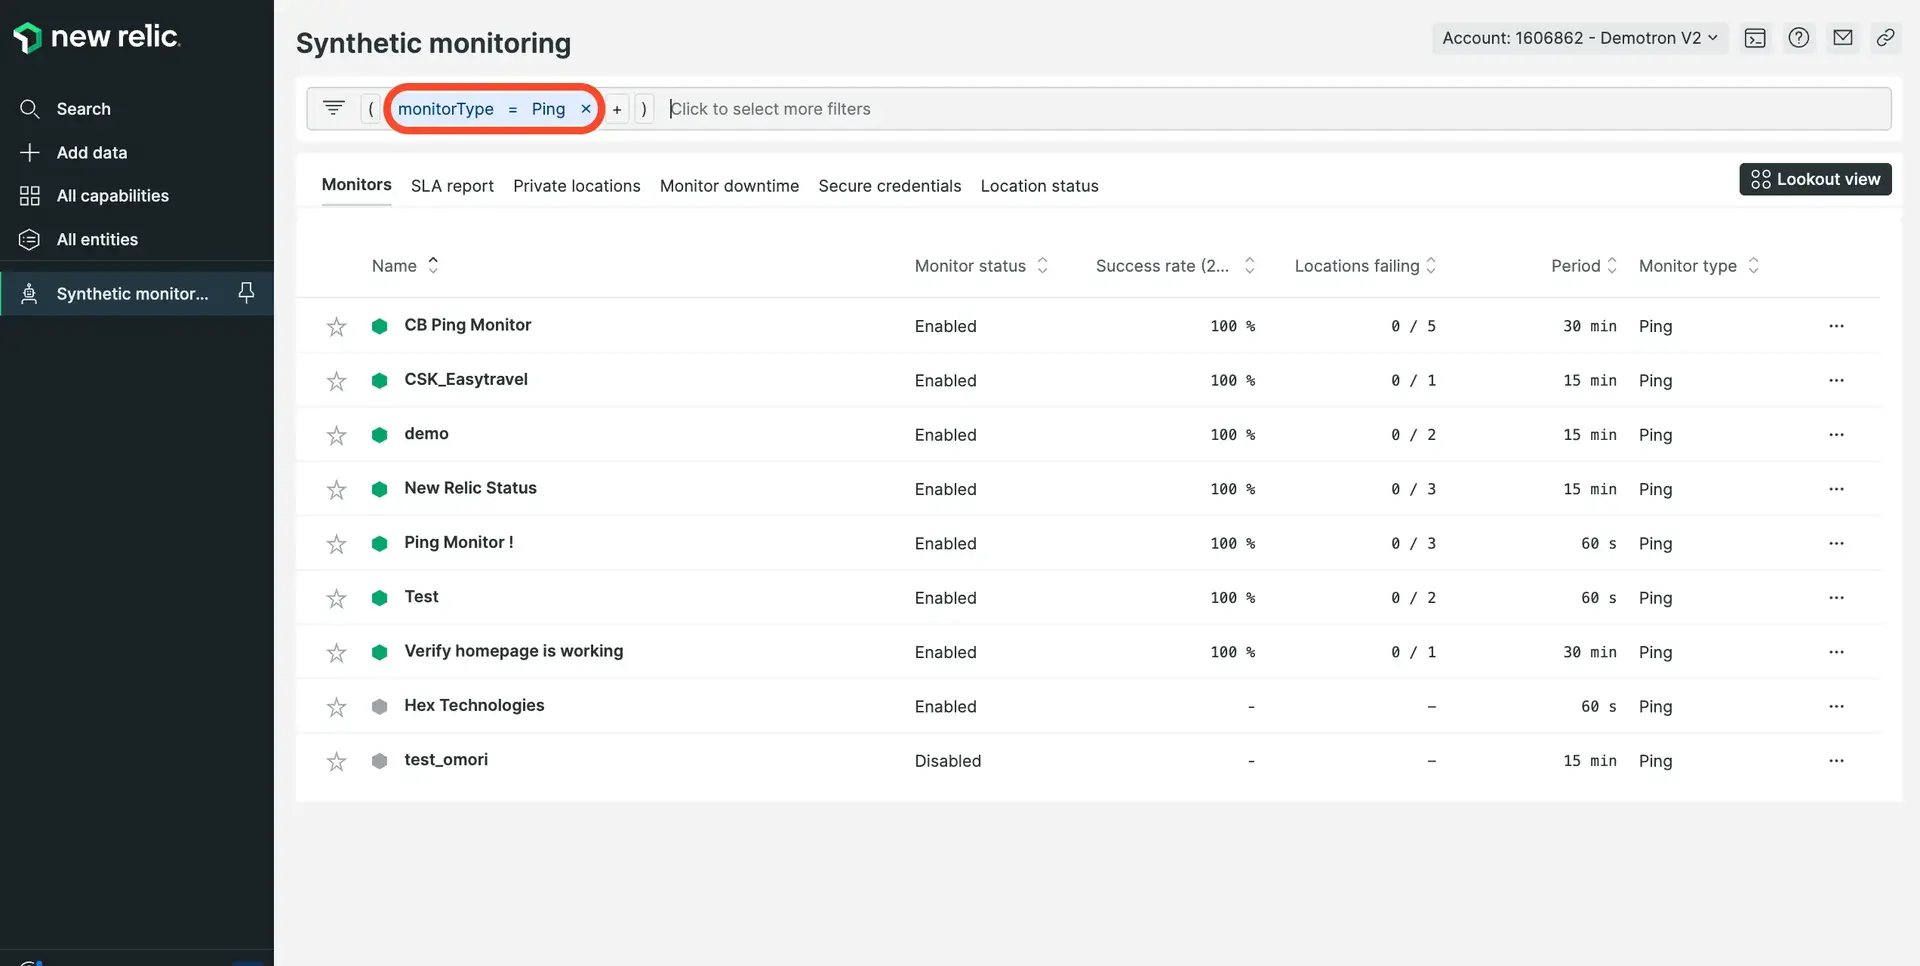
  2. Sort by Monitor Type using the query monitorType=ping.
  3. To view specific information about a monitor, such as page load time and availability, select a ping monitor to access the selected monitor's Summary and Results pages.
entitiy_ping_monitor_page.png

one.newrelic.com > Synthetic monitoring > (select a monitor): View a summary of the selected ping monitor including load time and total load size.

If you want to...

Do this...

Get details about page resources

Click on a specific ping monitor check to access Result Details view.

From the Result Detail view, you can:

  • See the exact order in which each page's resources loaded.
  • See how long each element took to load.
  • See detailed metrics, including HTTP status codes, timing information, response headers, and request headers.

View transaction traces

  1. Make sure you have enabled Synthetic transaction traces for the ping monitor you want to view.
  2. Go to one.newrelic.com > Synthetic monitoring > (select a ping monitor).
  3. Hover over the Timeline and click APM transaction trace.

Share a result

Copy the unique URL from your browser's address bar; for example:

https://one.newrelic.com/launcher/nr1-core.explorer#launcher=7890wxyz-7c6c-4786-94bc-31d58fc91a73

You can then share this URL with anyone else who has access to your New Relic account data.

Quickly access another monitor

  1. At the top of the screen, click on the name of the current monitor to open the dropdown menu.
  2. Select from the list of recent monitors, or enter a name in the search field to search for a specific monitor.

Timing details

For some monitor types, the overall monitor check duration will be larger than the individual page request durations. This is because some browser behaviors are not measured individually but still count towards the total check time.

Examples of unmeasured behaviors include:

  • JavaScript interactions
  • Resource pre-fetching and prioritization
  • DNS pre-resolve
  • TCP pre-connect
  • Page pre-rendering
Copyright © 2024 New Relic Inc.

This site is protected by reCAPTCHA and the Google Privacy Policy and Terms of Service apply.