As applications move towards the cloud, microservices architecture is becoming more dispersed, making the ability to monitor logs essential. New Relic offers a fast, scalable log management platform so you can connect your logs with the rest of your telemetry and infrastructure data in a single place.
Our solution provides deeper visibility into application and infrastructure performance data (events, errors, traces, and more) to reduce mean time to resolution (MTTR) and quickly troubleshoot production incidents.
Find problems faster, reduce context switching

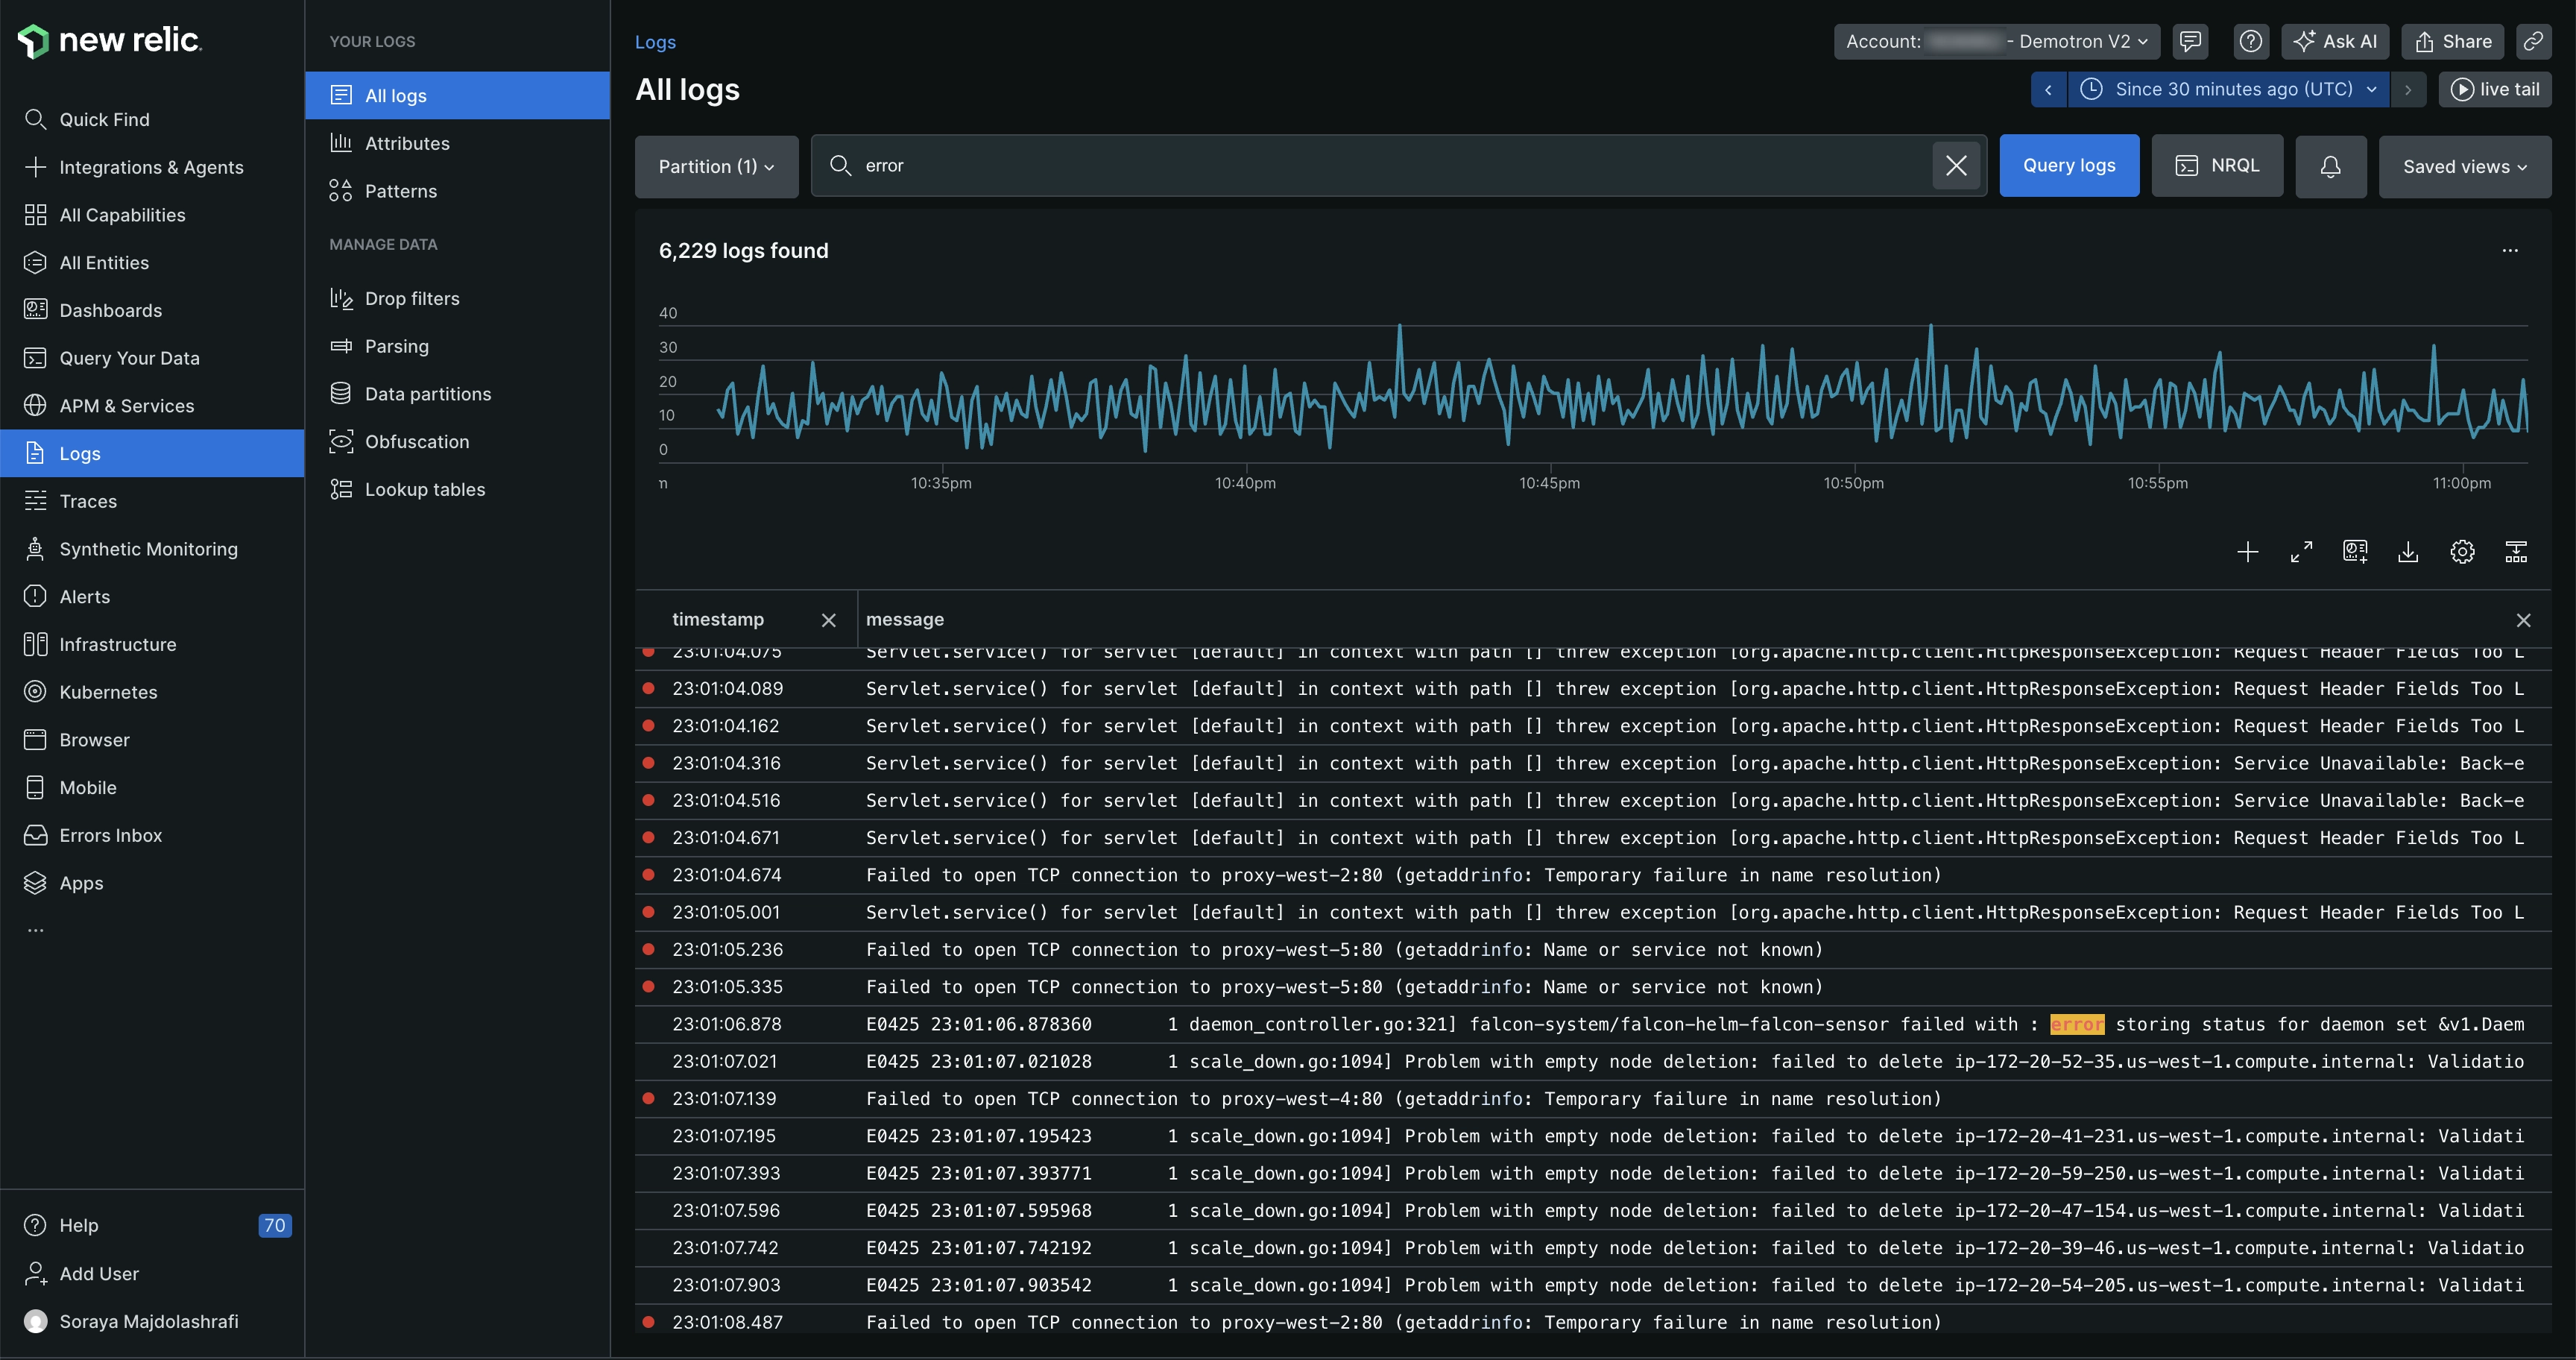
one.newrelic.com > All capabilities > Logs: From the main logs UI page, you can see all your logs and then filter down to logs with specific text, or other attributes.
Log management provides a way to connect your log data with the rest of your application and infrastructure data. You can get to the root cause of problems quickly, without losing context from switching between tools. For example, you can:
- Get relevant data across the New Relic UI that provides logs in context of issues in your apps and hosts.
- Dive deeper into log data by using our logs UI, and create custom charts, dashboards, and alerts.
- Instantly search through your logs.
- Troubleshoot performance issues without switching between other tools.
- Visualize everything in a single place.
Curious about costs?
Want to estimate the cost of reporting your logs? Use our cost estimator tool. Also note that once you start using New Relic log management, it's easy to adjust your logs ingest.
Report logs
To forward your log data to New Relic, you can use one or more of these options:
- Use our agents to report logs. By default, our APM agents do two things: add metadata to your logs, which gives you logs in context (ability to see logs data in various relevant places in our platform) and forward your logs to New Relic. This is a popular option for DevOps teams and smaller organizations because it lets you easily report application logs, with no additional third-party solutions required. Learn more about APM logs.
- Use our infrastructure agent to report logs. With our infrastructure agent, you can capture any logs present on your host, including your app logs. Compared to using an APM agent to report logs, this can take a little more setting up but gives you much more powerful options (for example, ability to collect custom attributes, which you can't do with agents).
- Use third-party log services. We have a wide range of integrations for other log services, including Amazon, Microsoft, Fluentd, Fluent Bit, Kubernetes, Logstash, and more.
- Reports logs using the Log API or TCP endpoint.
- Use the OpenTelemetry SDK to send logs from your apps to an OpenTelemetry Collector, which can forward them to New Relic via OTLP.
For more on log forwarding options and specific use cases, see Forward logs.
View and manage logs in the UI
To find your logs in New Relic:
Go to: one.newrelic.com > All capabilities > Logs. For details on what you can do in the UI, see Logs UI.
You can also query the Log data type. Here's a simple example NRQL query:
SELECT * FROM LogYou can also use NerdGraph, our GraphQL-format API to query data, or to configure log management.
User access
Access to log management permissions depends on a user's user type. For more details, see User type.
For information on log-related permissions, see Permissions.
In addition to role-based permissions, you can control which users can access specific log data using data access control. This lets you restrict or allow access to specific log partitions based on user groups.
What's next
Ready to get started with our log management solutions?
- If you don't have one already, create a New Relic account. It's free, forever.
- Set up one of our options for reporting logs.
- Explore relevant log data across your platform, including errors, distributed traces, hosts, and more.
- Use our Logs UI as an easy workflow through all logs, attributes, patterns, live-tail logging, and queries. Add alerts, query your data, and create dashboards.
Sugerencia
Do you use Datadog to monitor your logs but want to try out New Relic's monitoring capabilities for free? See our guide on how to migrate from Datadog to learn how.