Auto-telemetry collected by Pixie can be found throughout New Relic's UI. Use Pixie telemetry data to do the following:
- Monitor service health
- See pod application CPU profiles
- Monitor networking issues
- Inspect full-body requests
The UI of New Relic pulls Pixie telemetry data from both short-term and long-term storage. Find out more about the hybrid storage model for the New Relic Pixie integration here.
Monitor service health
Pixie automatically traces HTTP (including HTTP/2) requests sent between services, even if one endpoint is outside of the cluster.
The New Relic Pixie integration exports HTTP spans from Pixie to New Relic for long-term storage using the OpenTelemetry protocol. The Services - OpenTelemetry view lists the services automatically identified by Pixie, along with a high-level overview of service response time, throughput and error rate.
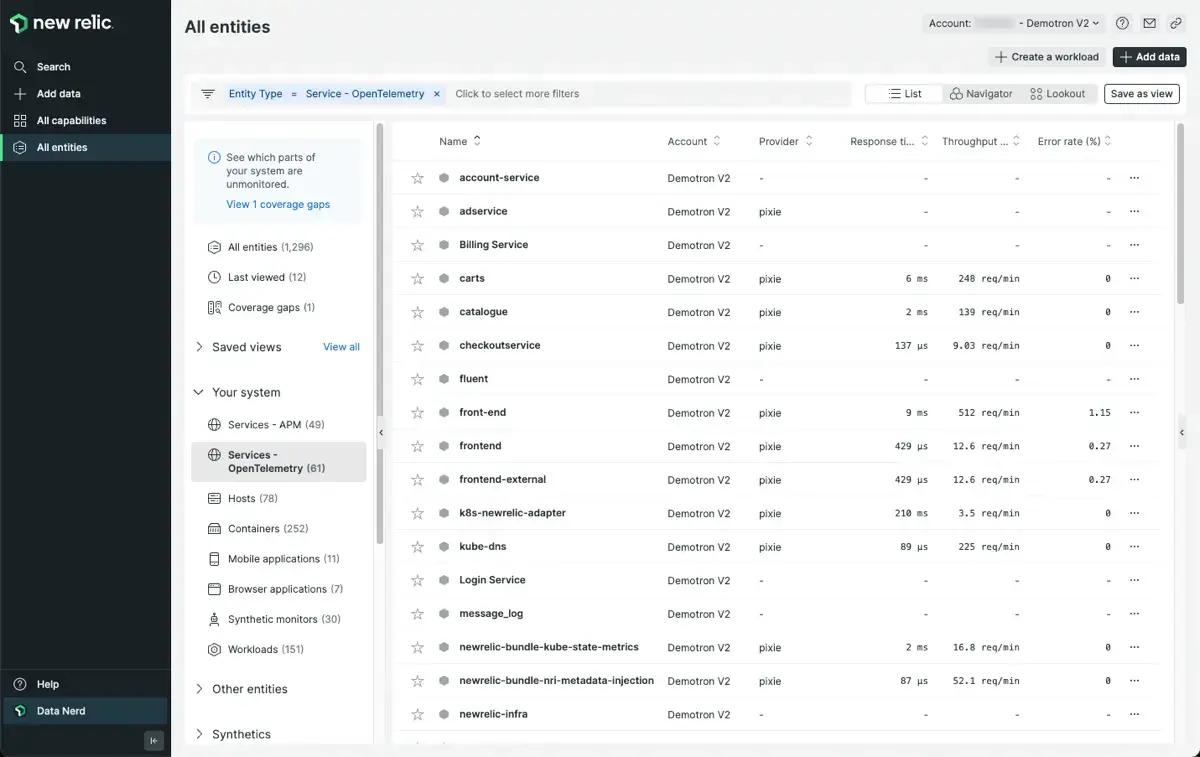
The Services - OpenTelemetry view lists all services identified by Pixie along with high-level latency, error and throughput details.
Selecting a service from this list will open the service Summary view which shows graphs of the response time, throughput and error rate for all HTTP requests made to this service.
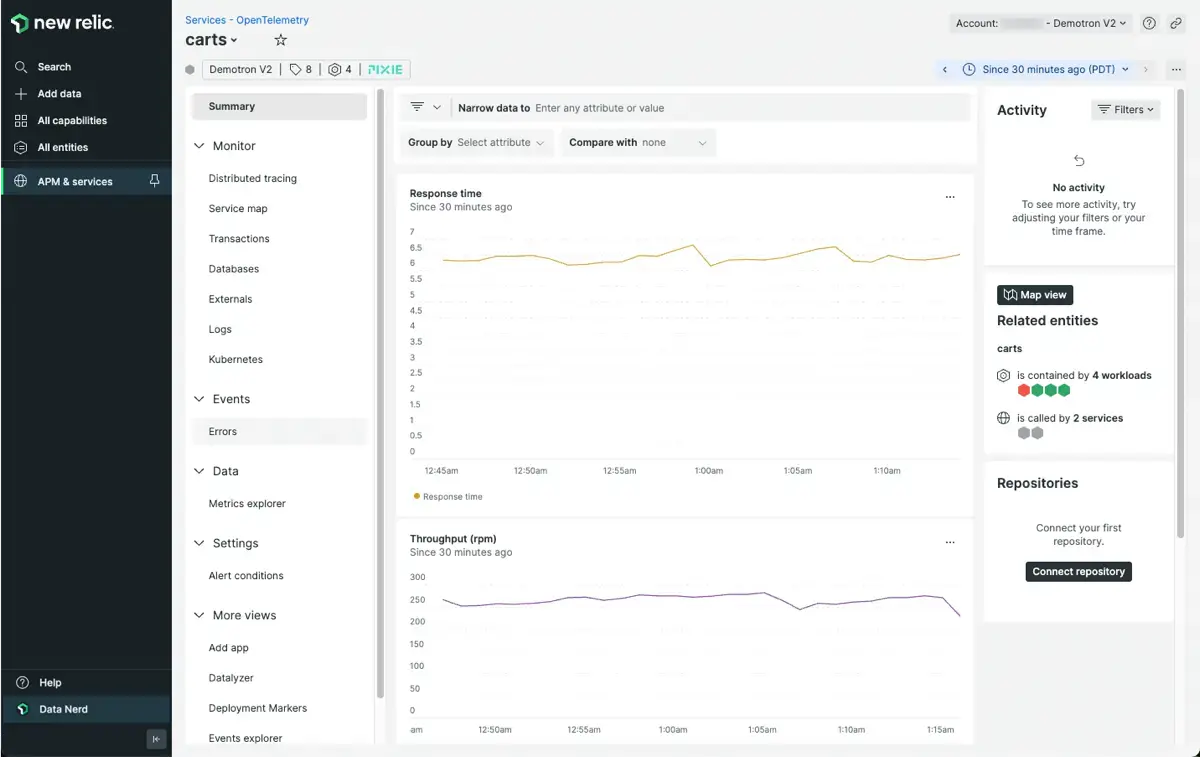
The OpenTelemetry service Summary view shows graphs of response time, throughput and error rate over time.
From the OpenTelemetry service view, select the Service map tab in the left sidebar. This service map view helps visualize your application's dependencies by showing a graph of all the entities that the service communicates with.
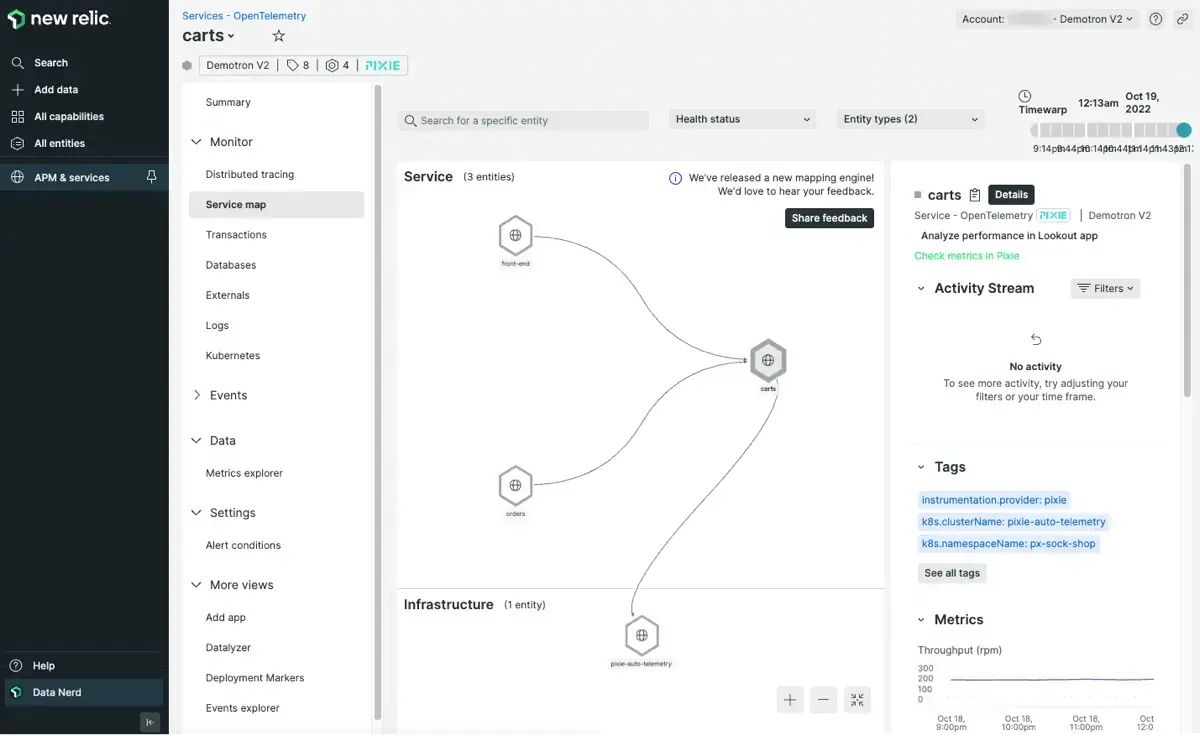
The OpenTelemetry Service map view shows helps visualize your application's dependencies.
The OpenTelemetry service Transactions tab shows the different endpoints that the service makes requests to. You can sort the endpoints by response time or throughput.
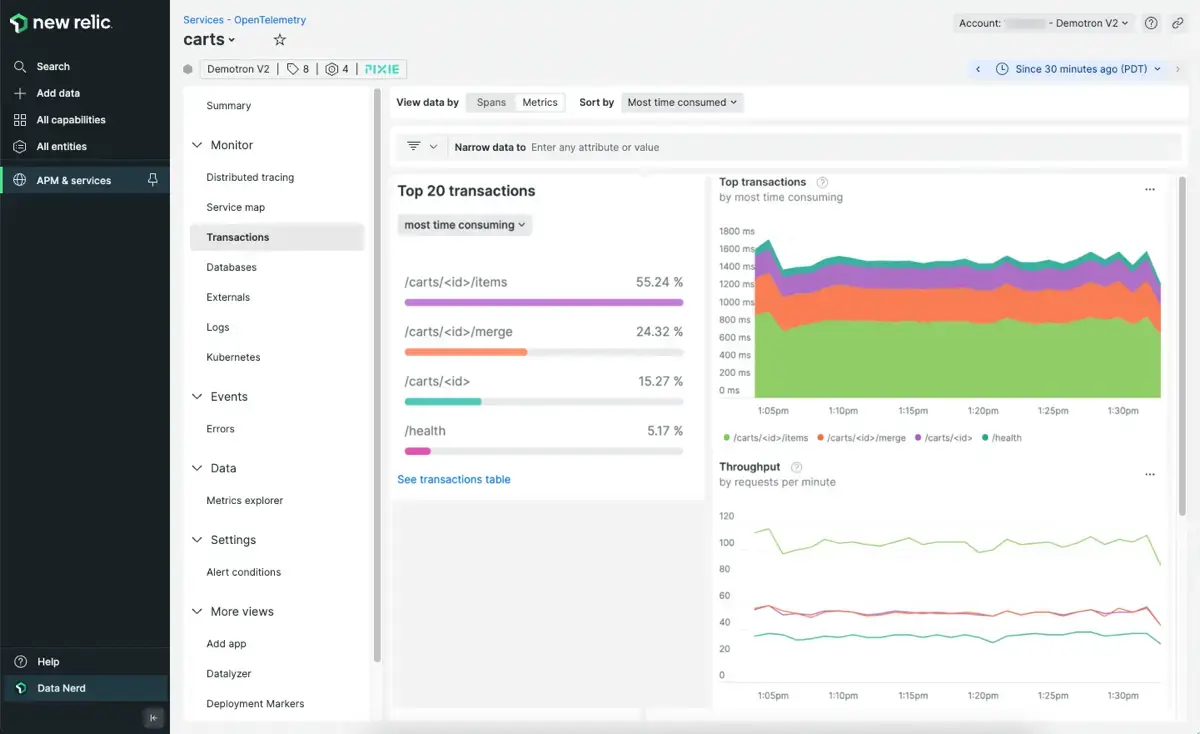
Pixie data seen in the OpenTelemetry Transactions tab.
The Databases tab shows any database requests the service makes.
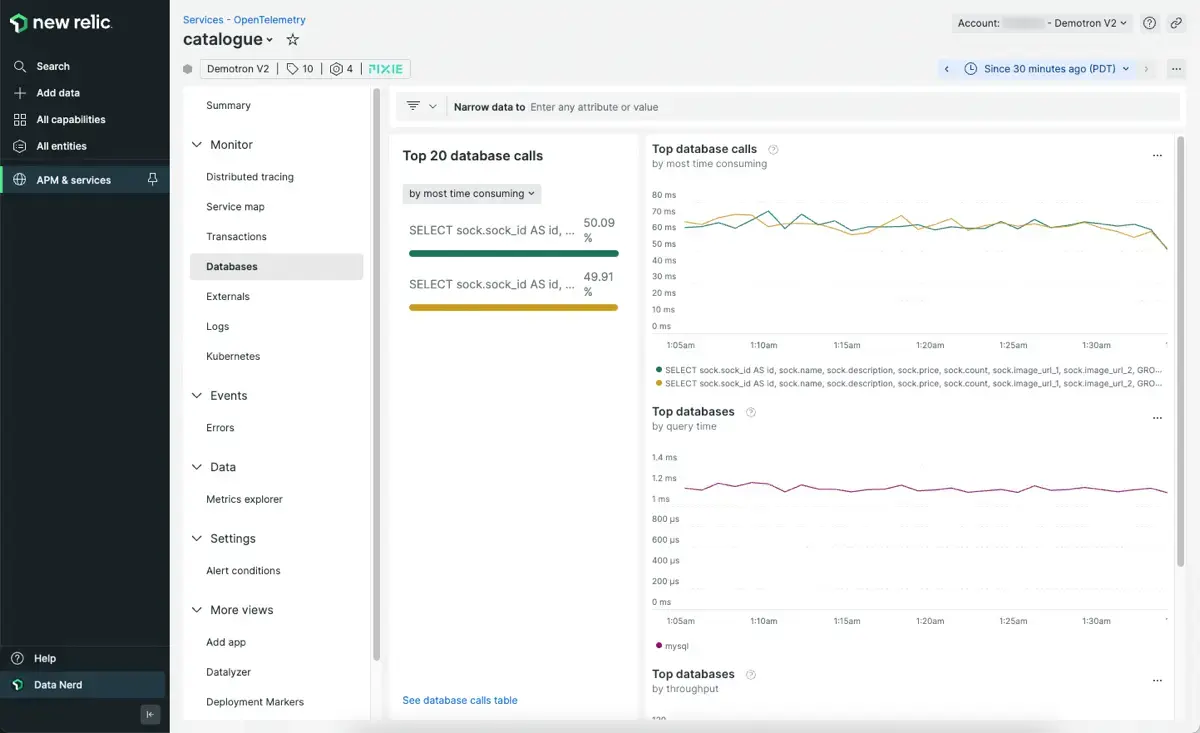
Pixie data seen in the OpenTelemetry Databases tab.
Service health information powered by Pixie can also be found from the Kubernetes cluster explorer (KCE) views. The KCE summary view includes all services automatically identified by Pixie.
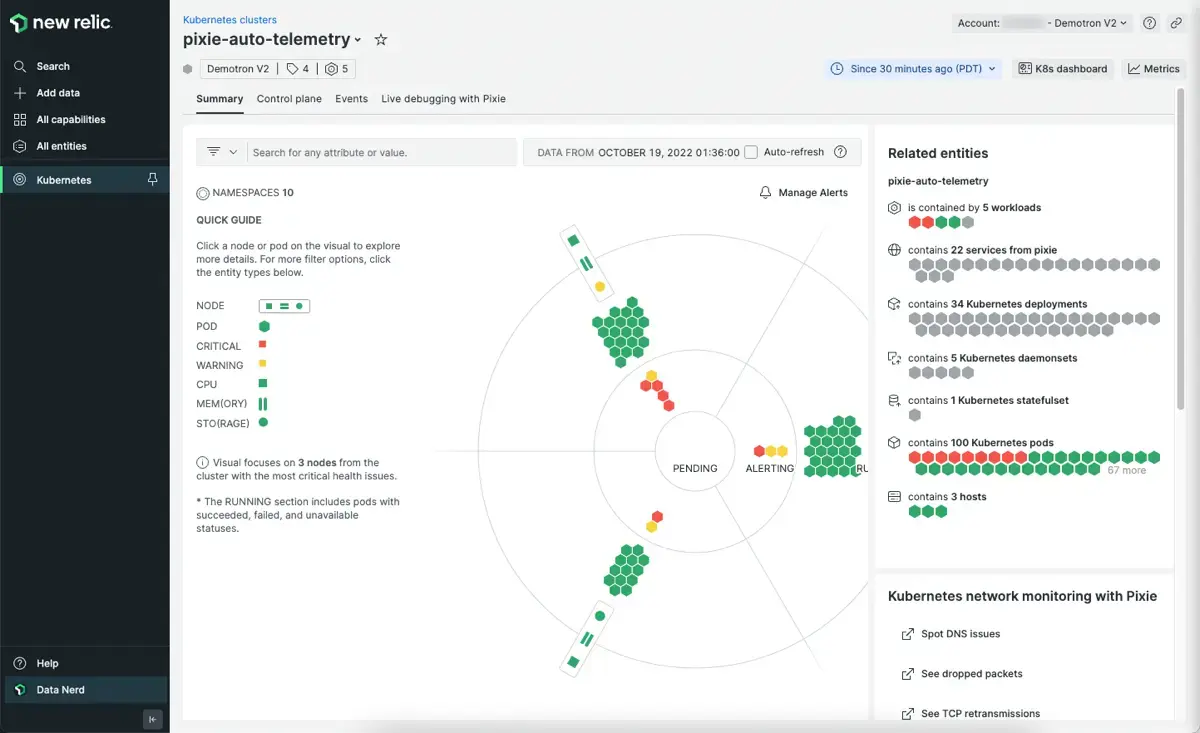
The Kubernetes cluster explorer shows the services identified by Pixie.
Selecting a service shows the service details sidebar with HTTP throughput, error rate and response time data collected by Pixie:
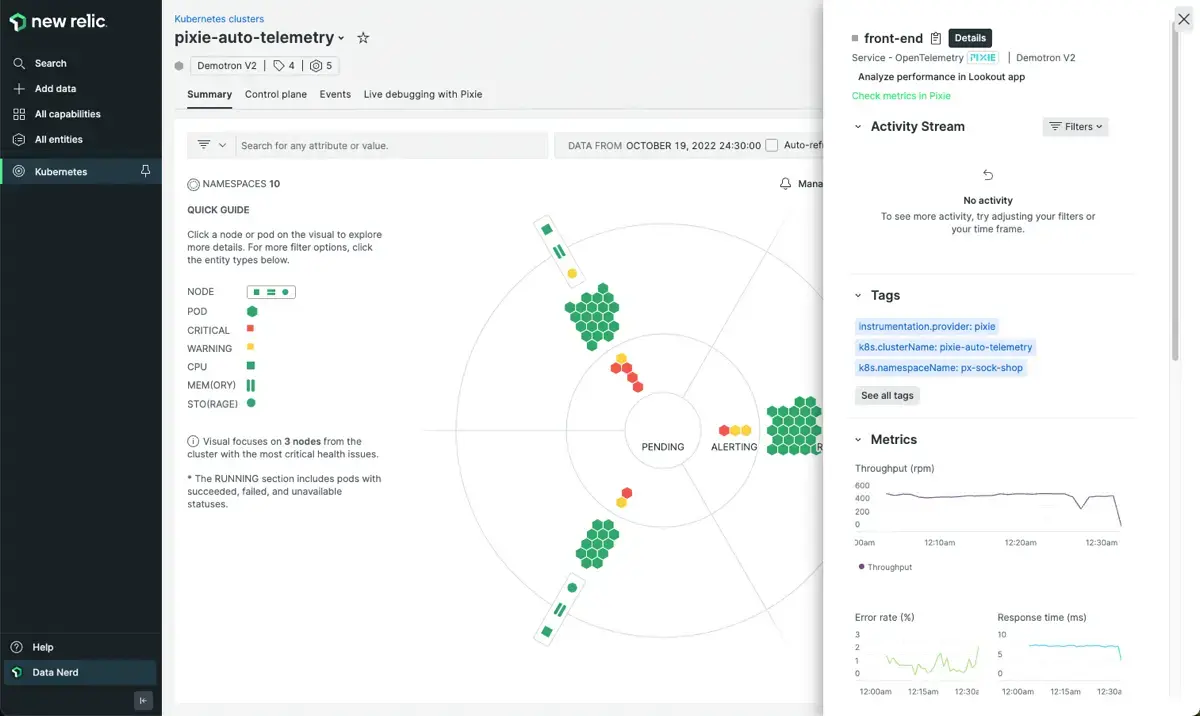
The pod details page in the Kubernetes cluster explorer shows application metrics collected by Pixie.
At the bottom of the service details view, select the Map View button in the Related Entities section.
This map view helps visualize your application's dependencies by showing a graph of all the entities that the service communicates with.
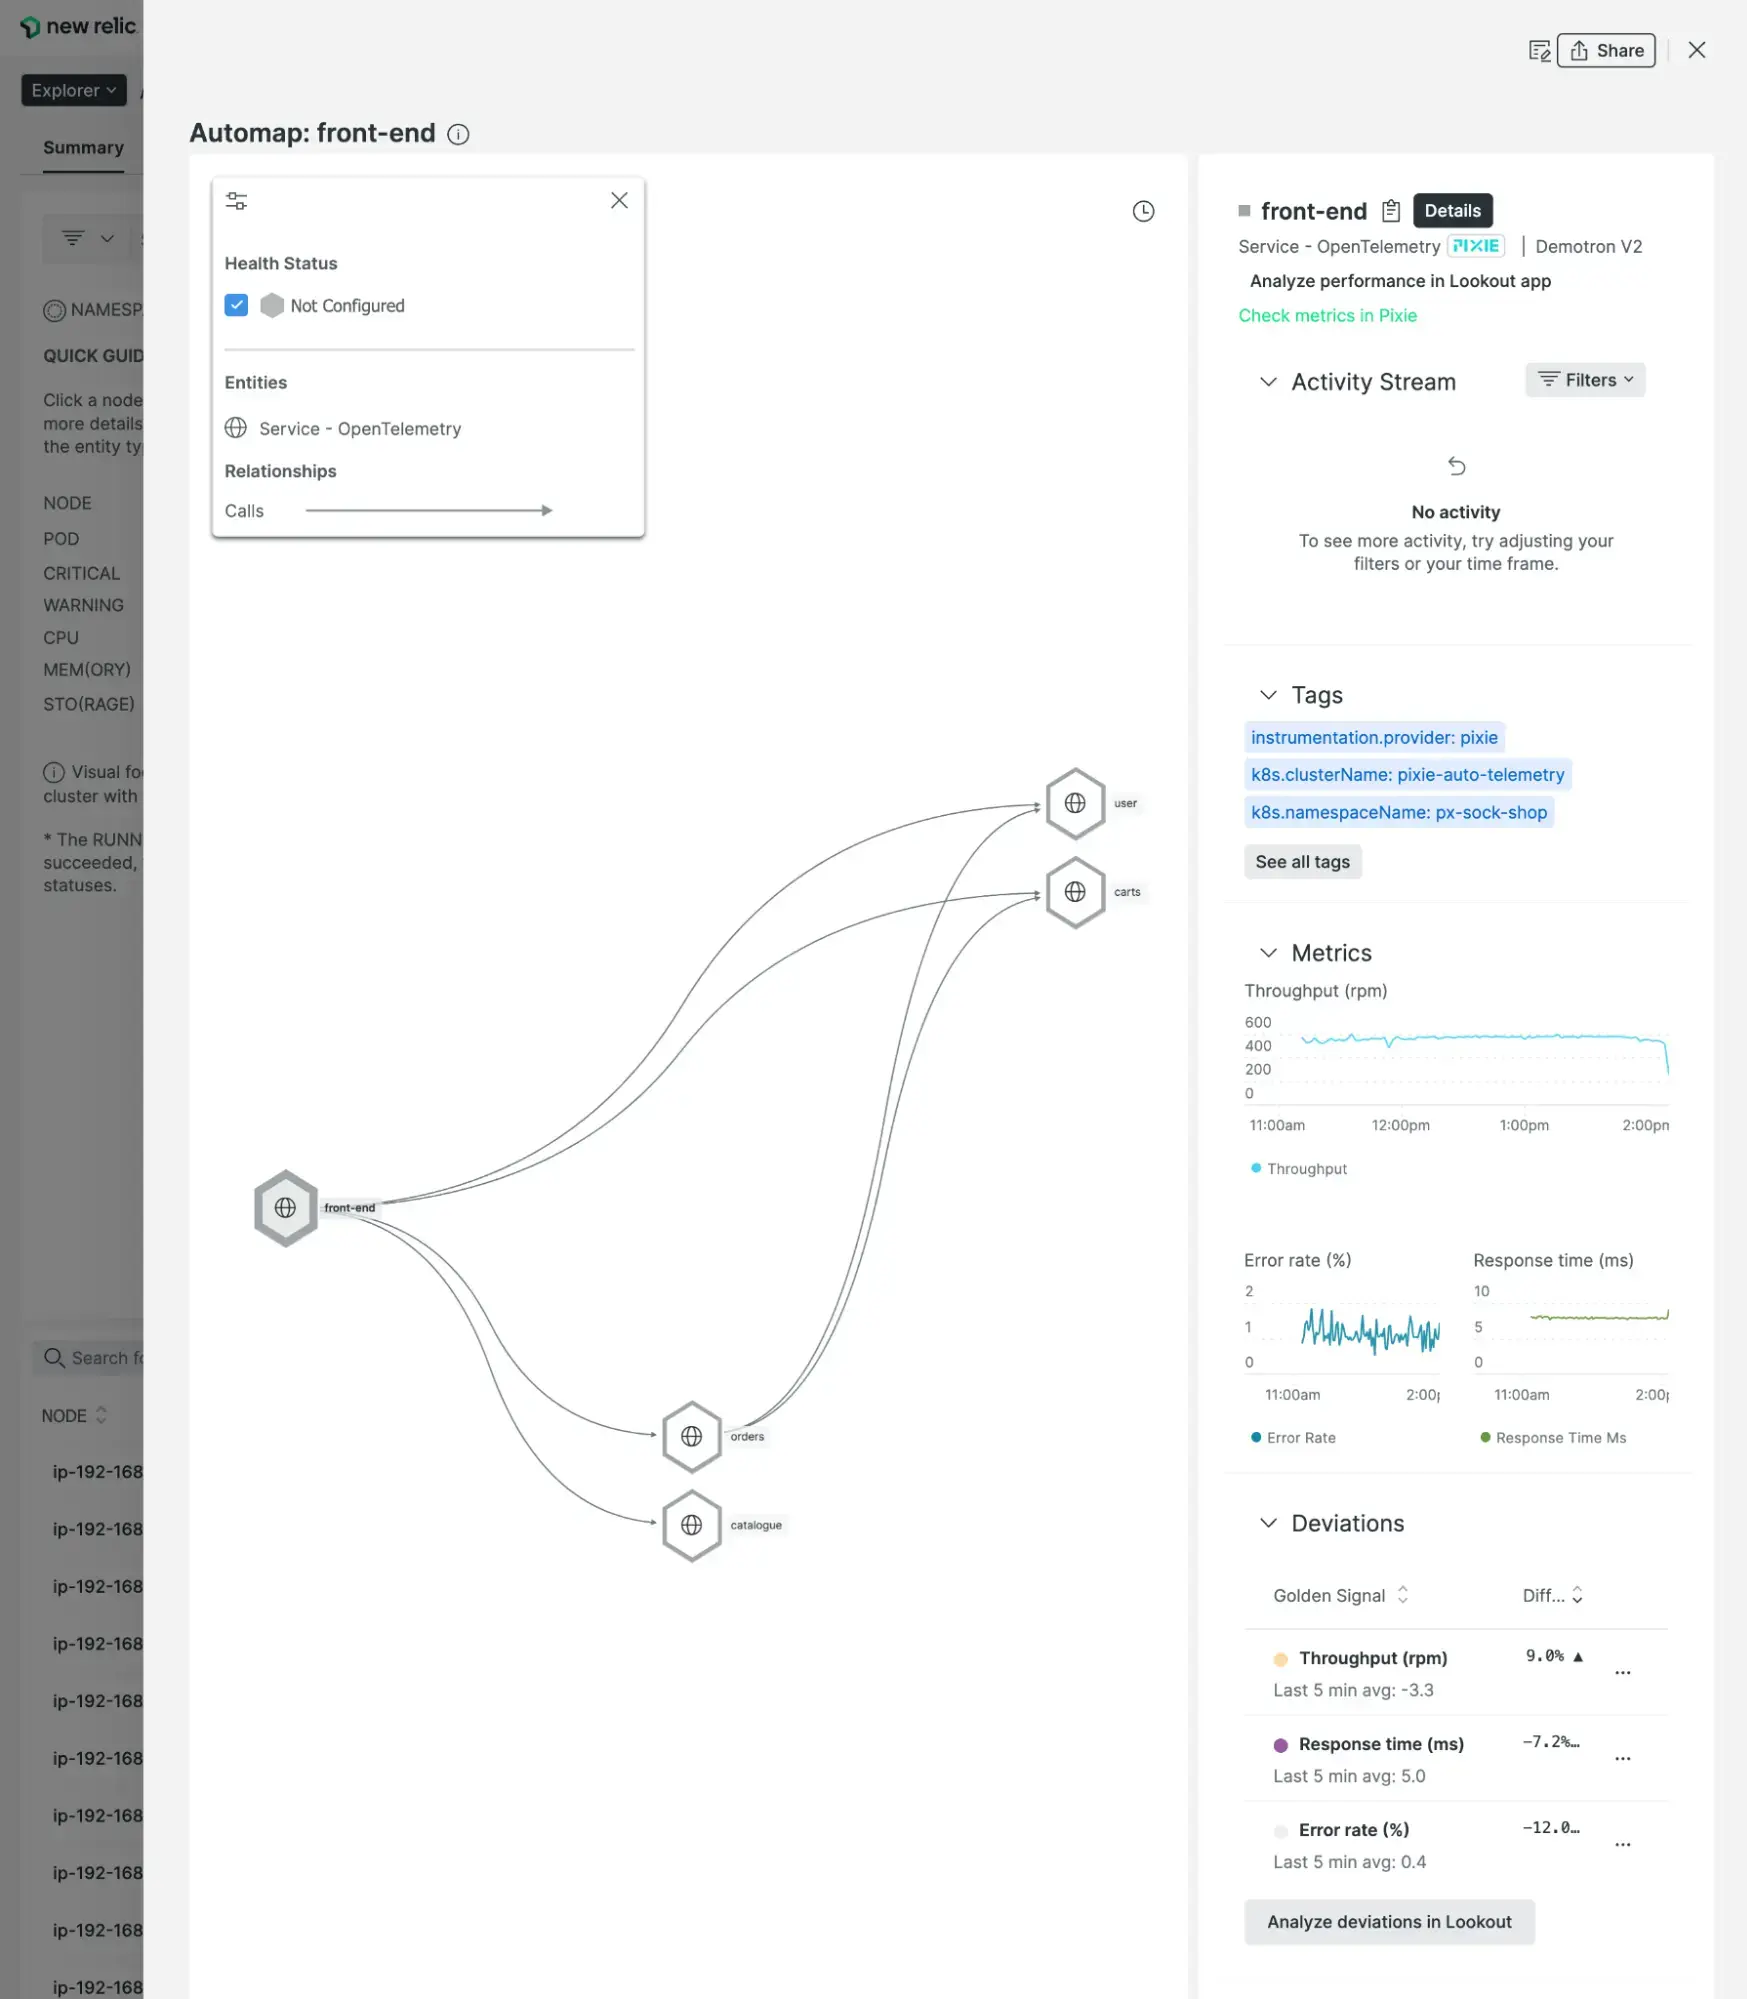
The service map shown in the pod details view is constructed using HTTP traces collected by Pixie.
At the top of the service details view, select Check metrics in Pixie to be taken to the px/service script in the Live Debugging with Pixie tab. The px/service script shows a high-level overview of this service performance statistics as well as inbound requests using the short-term Pixie data stored on your cluster.
See pod application CPU profiles
You can use Pixie's continuous profiling feature to investigate spikes in CPU utilization or to identify performance issues within your application code.
Select a pod listed in the Kubernetes cluster explorer view to see the pod details view.
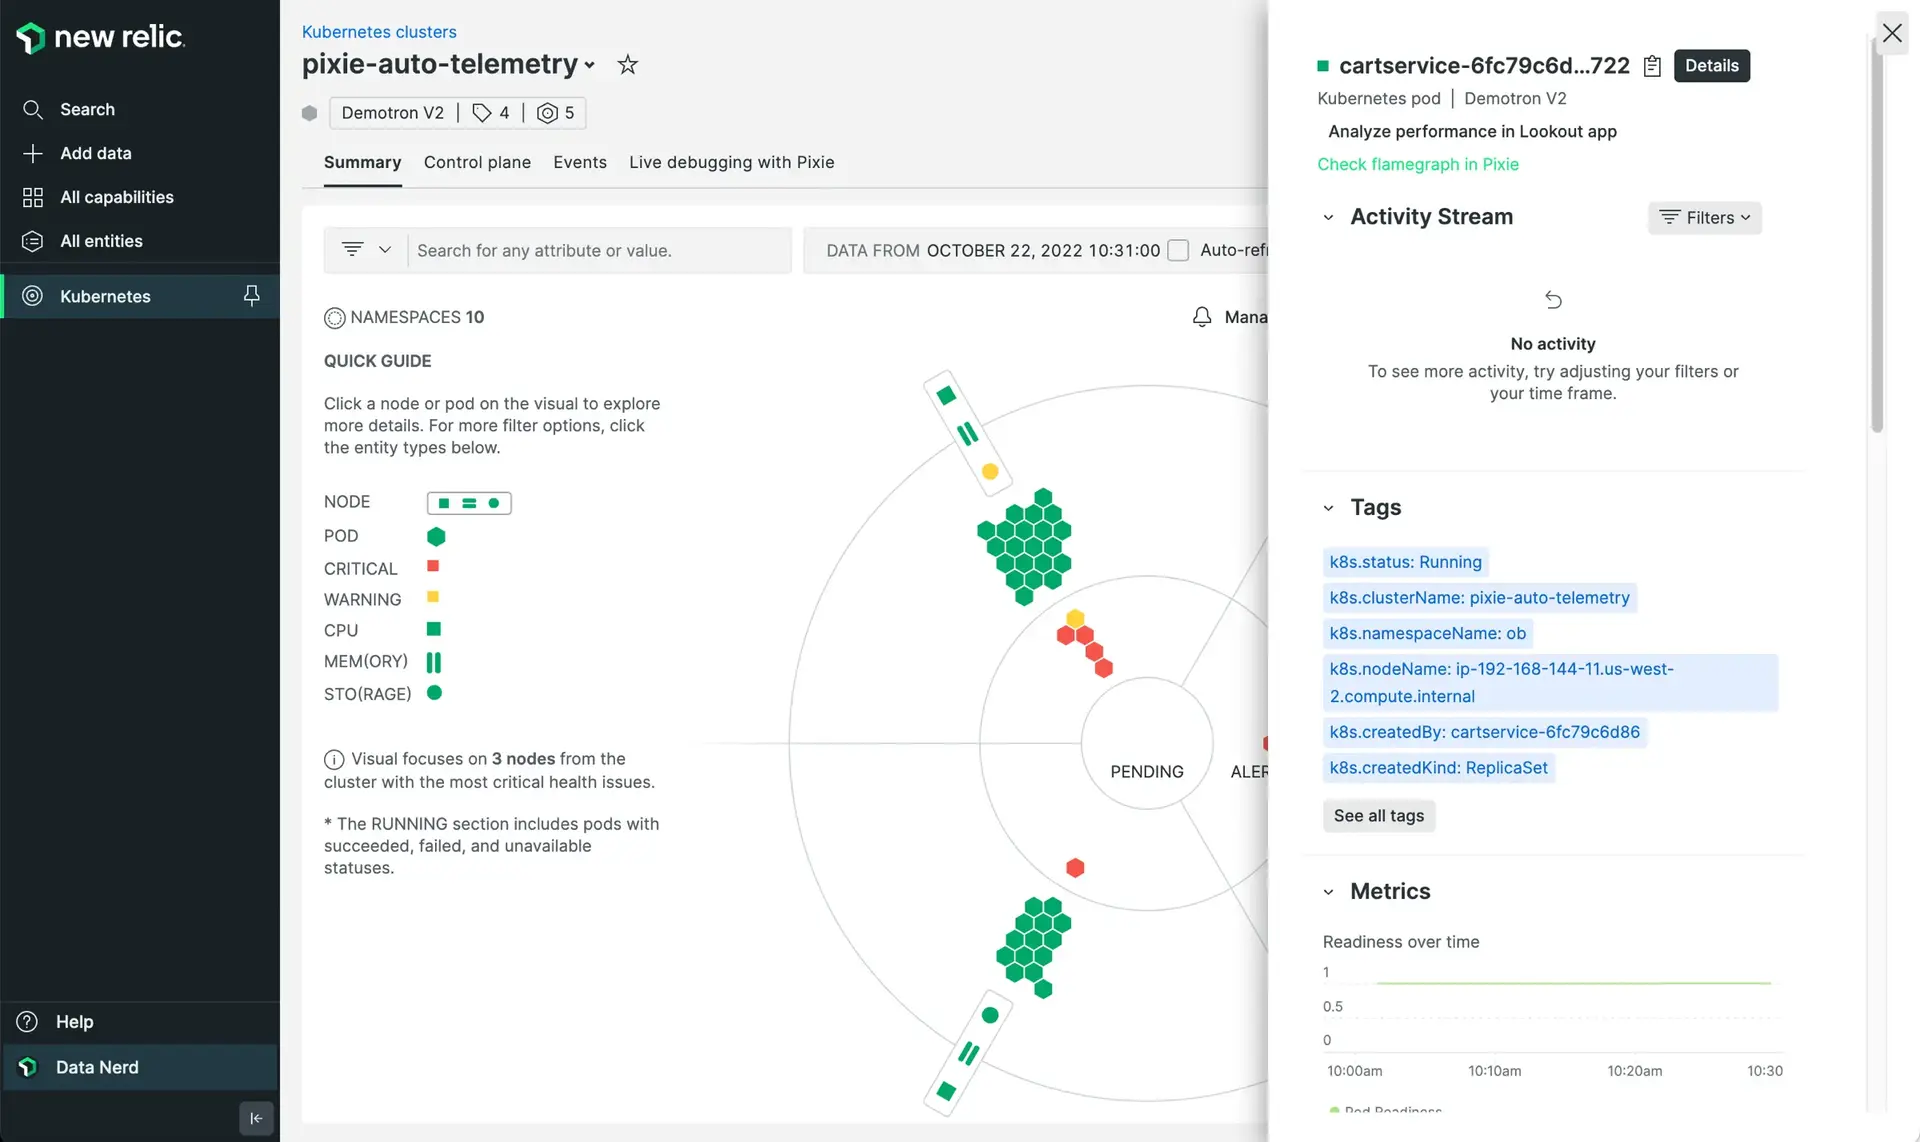
The Pod details view in the Kubernetes cluster explorer has an option to Check flamegraph in Pixie.
From the pod details view, select the Check flamegraph in Pixie option to see a CPU profile using the rich set of data Pixie stores in short-term storage on your cluster.
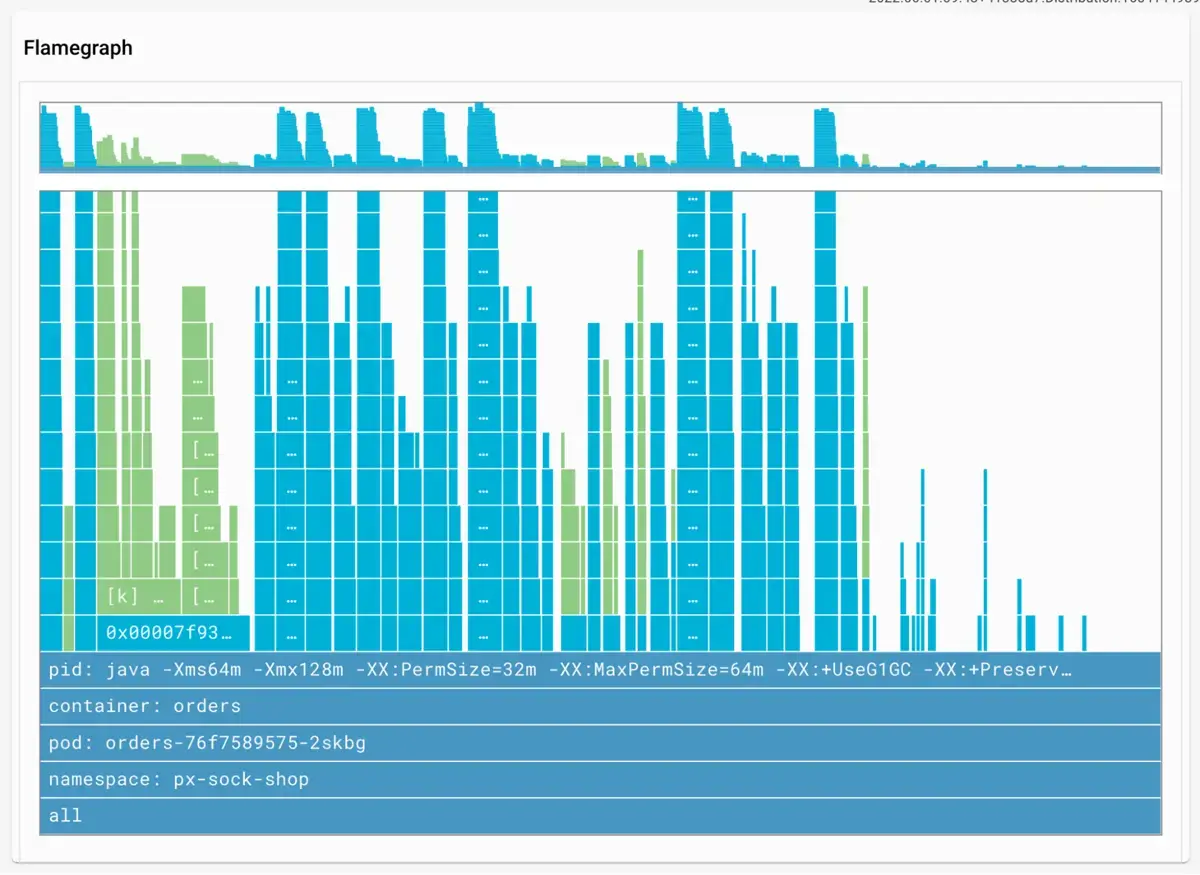
Use Pixie to see CPU flamegraphs for your Kubernetes pods.
To see a CPU flamegraph for a Kubernetes node, use the px/node script in the Live debugging with Pixie tab. Scroll to the bottom of this view to see the CPU flamegraph for the node.
Learn how to interact with Pixie's CPU flamegraphs in the Continuous Profiling Tutorial.
Monitor networking issues
You can use Pixie to monitor your Kubernetes network alongside your application and infrastructure layers.
The Summary tab of the Kubernetes cluster explorer contains a Kubernetes network monitoring with Pixie section. Each view linked in this section is powered by the rich set of Pixie telemetry data stored in short-term storage on your cluster.
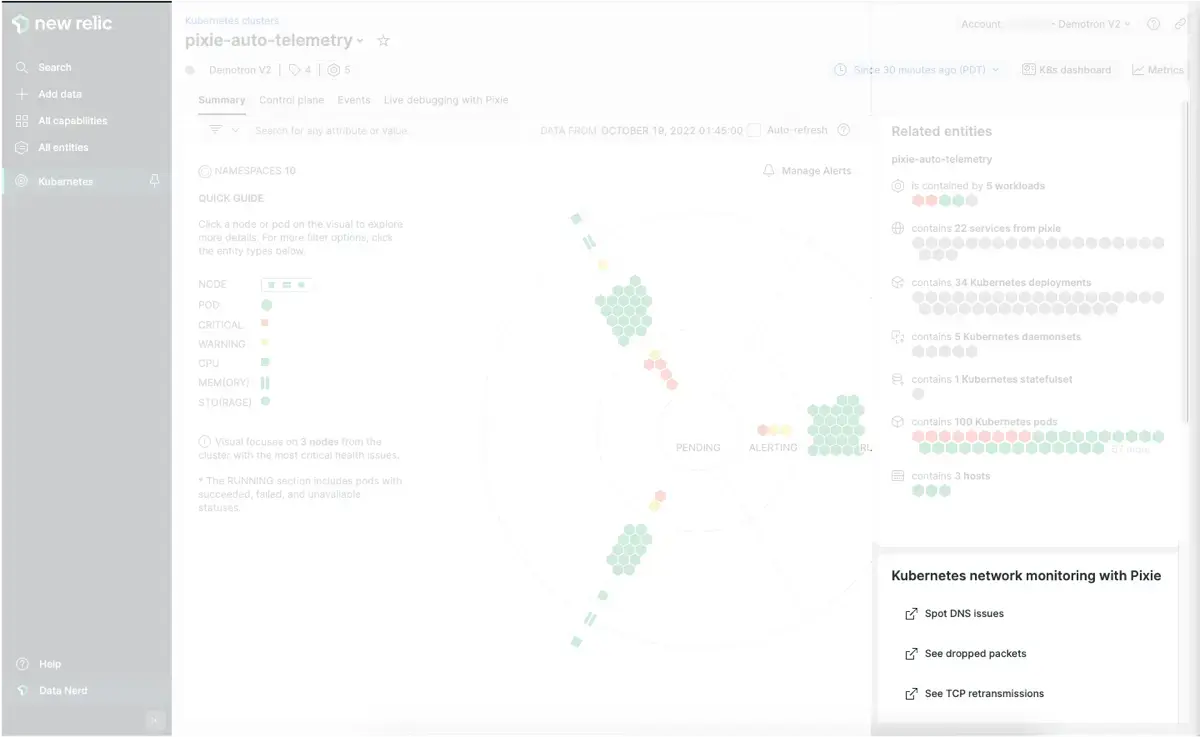
Use Pixie for Kubernetes network monitoring.
The Spot DNS issues link will show you a graph of all the DNS requests in your cluster. Hover over any edge on the graph to see latency and throughput information.
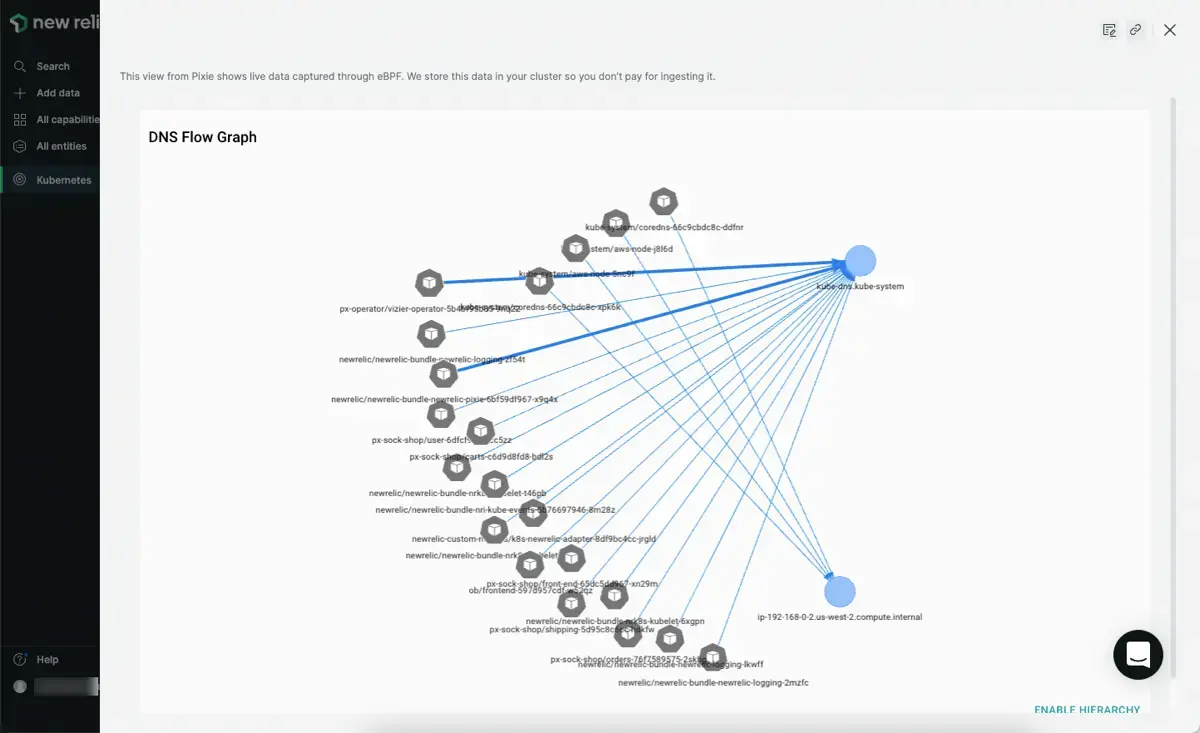
Spot DNS issues in your cluster using Pixie's DNS flow graph.
The See TCP retransmissions and See dropped packets links will show graphs of the TCP retransmits and TCP drops in your cluster. Note that you'll need to press the RUN button to see results for these views. The TCP drops output is shown below:
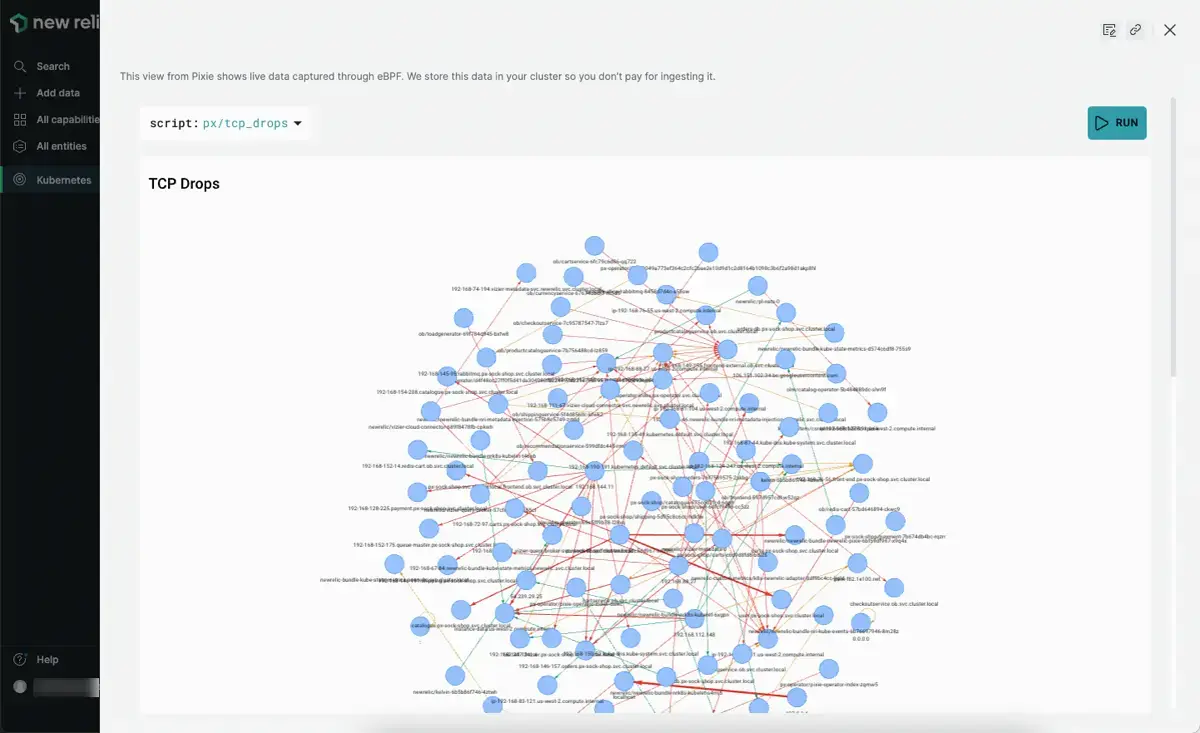
See TCP drops and TCP retransmissions in your cluster using Pixie.
Note that the above Kubernetes network monitoring with Pixie views can also be seen in the Live debugging with Pixie tab using the px/dns_flow_graph, px/tcp_drops and px/tcp_retransmits scripts. These scripts have optional arguments that allow you to filter the output to select entities.