Once you've installed the baseline dashboard, you should keep an eye on it to detect any ingest anomalies as often as possible. While you have to wait until you have enough data to optimize your ingest, you can use your dashboard to find issues with your ingest much sooner. You can use the baseline dashboard as is, or download optional dashboards to give you even greater anomaly detection options.
You should also set up to help notify you of issues as they occur. You can use our ingest alerts guide to create a large variety of alerts, but we recommend you set up these two alerts as a minimum:
- A threshold alert to notify if you exceed monthly targets for data ingest beyond seasonal increases
- An anomaly alert to notify you of a sudden sharp increase ingest data
Tip
New to creating alerts with our platform? Check out our alert creation and management tutorial to learn everything you need about creating New Relic alerts.
Monitor anomalies with Lookout view
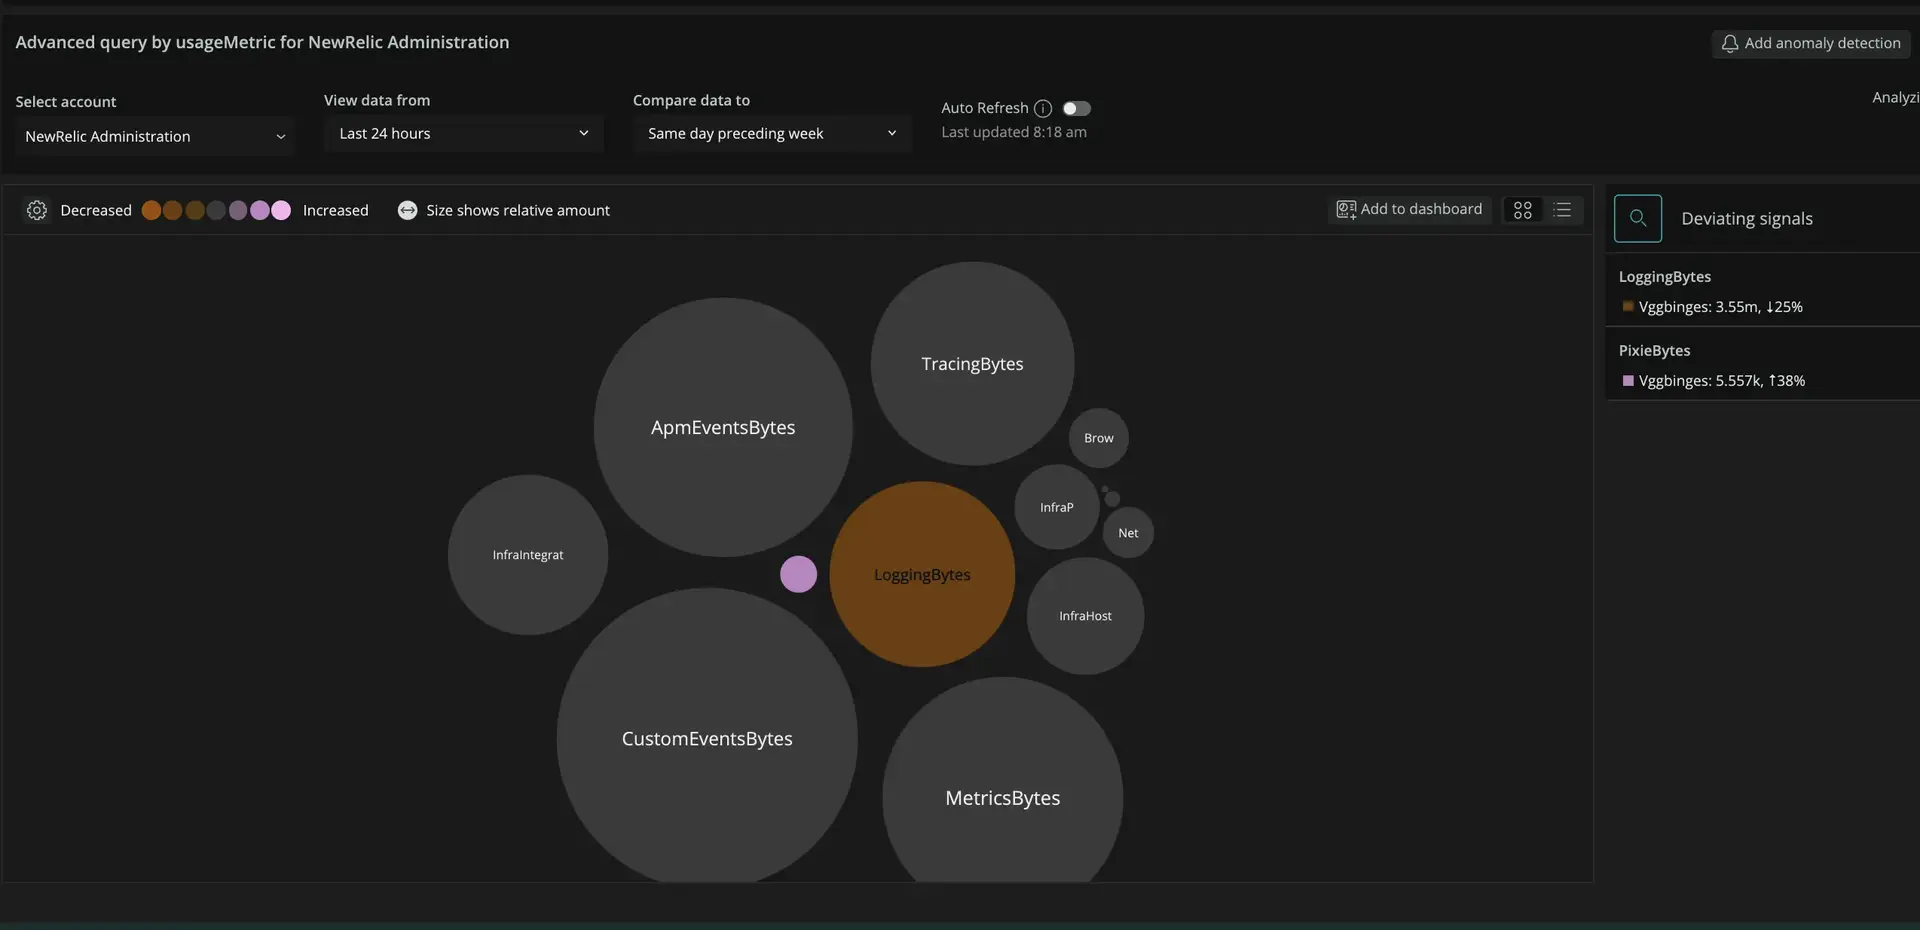
After installing the dashboard, you can get a high-level view of your ingest patterns with the Lookout view. From there, you can create NRQL queries to search for any ingest anomalies. For example, the following NRQL query will give you information on all ingest anomalies by usageMetric over the last 24 hours:
SELECT rate(sum(GigabytesIngested), 1 day) AS avgGbIngest FROM NrConsumption WHERE productLine='DataPlatform' FACET usageMetric
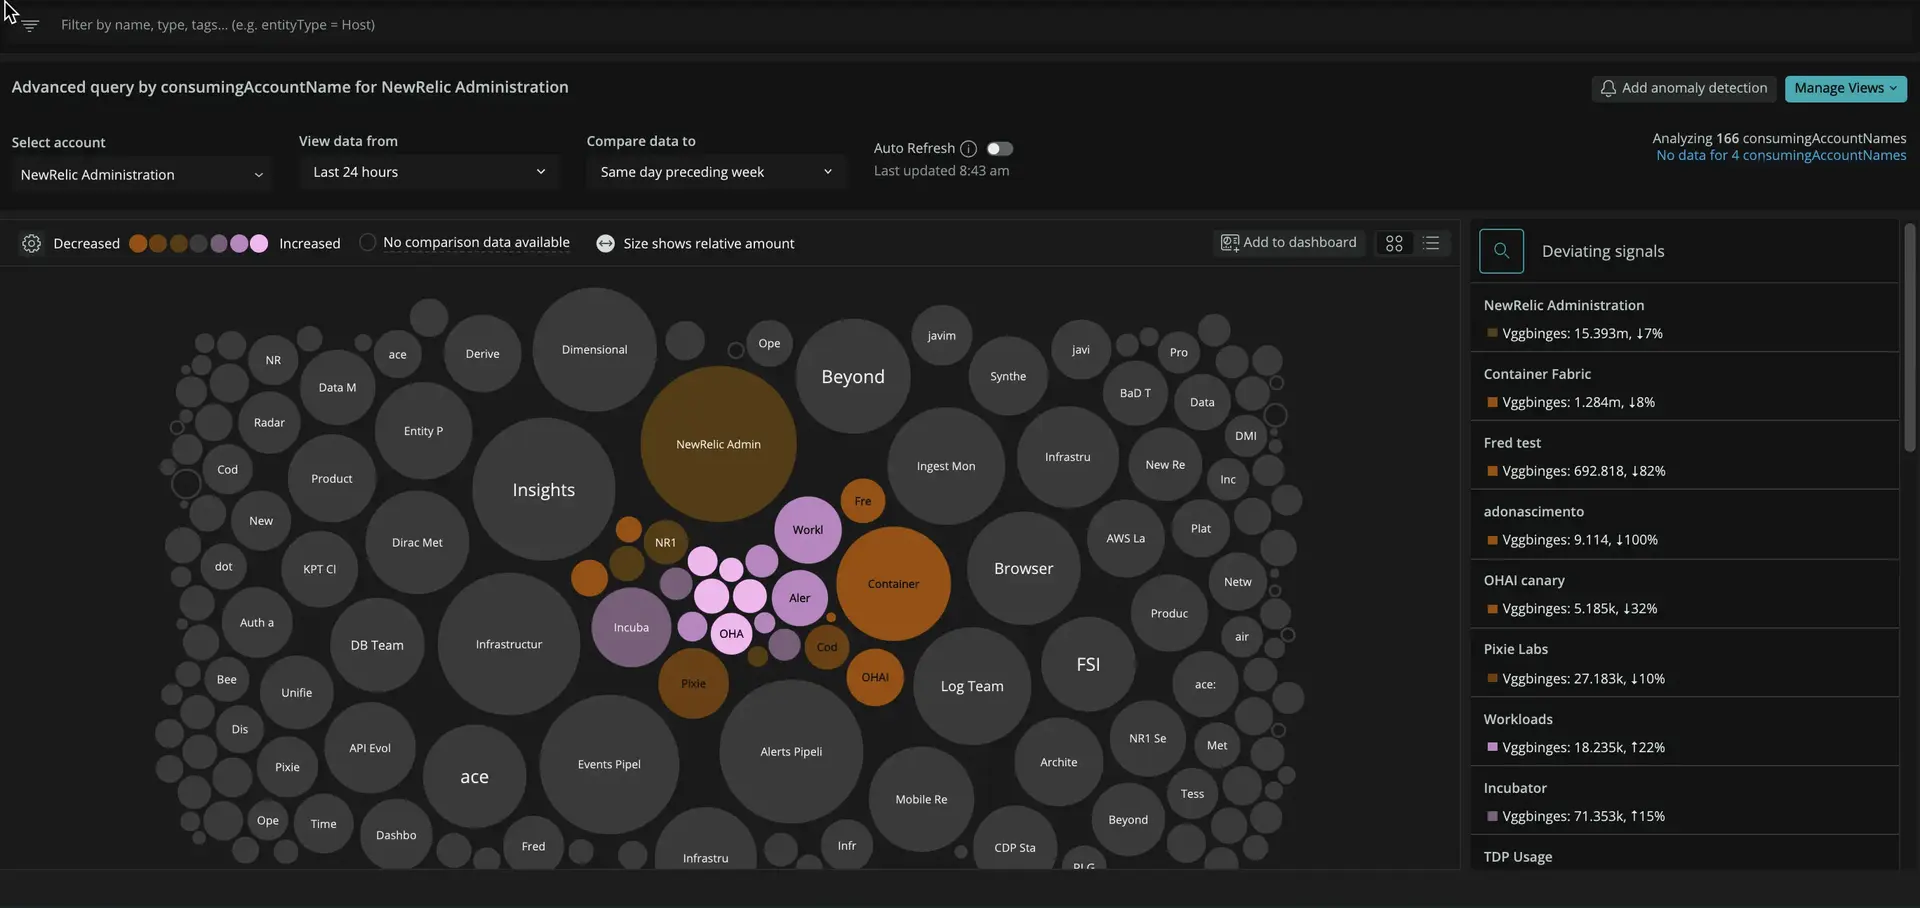
You can change the facet field to anything you want to get more, or less, granularity on your ingest data. For example, changing usageMetric to consumingAccountName would give you even more detailed information by reporting on ingest by account name, as shown below:

Install the entity breakdown dashboard (optional)
The ingest baseline dashboard that uses NrConsumption as its primary source. But you may find that you also want information on estimating ingest traffic for other events or metrics. If you do, you can install the entity breakdown dashboard, which helps you create other visualizations that use bytescountestimate() to help estimate your ingest data.
To install the entity breakdown dashboard:
Go to the same quickstart you used for the baseline dashboard.
Select Install this quickstart.
Install the dashboard into any account that contains , , mobile monitoring, or Kubernetes clusters using the import dashboard function. You can install this dashboard into multiple accounts, but avoid installing this dashboard into a partnership owner account, or POA.
Tip
If you have a parent/child account structure, you can install the dashboard into a parent account and modify the dashboard so you have account-specific charts all in one dashboard.
Select Done.
When the quickstart finishes installing, open the Data governance entity breakdowns dashboard to access your data.
You can refer back to this section to see exactly which event types are used in these breakdowns. Note that these queries consume more resources because they don't work from a pre-aggregated data source like NrConsumption, so you may need to adjust the time frames by using additional WHERE and LIMIT clauses to make them work better in some of your environments.
Install the cloud integration dashboards (optional)
New Relic's cloud integrations often give you a significant source of data ingest growth. But without good visualizations, it's often difficult to find where the ingest growth comes from. It's usually because these integrations aren't part of an organization's normal CI/CD pipeline or they aren't part of normal configuration management system.
Fortunately, we have a set of dashboards that you can install directly from New Relic Instant Observability. The individual dashboards installed by this package include:
- AWS integrations
- Azure integrations
- Google Cloud Platform integrations
- On-host integrations
- Kubernetes
What's next?
If you've followed the tutorial so far, you have installed at least the baseline dashboard, generated a report, and have set up systems to help you detect your ingest anomalies. There's only one further step to take: using your ingest data to optimize your telemetry!