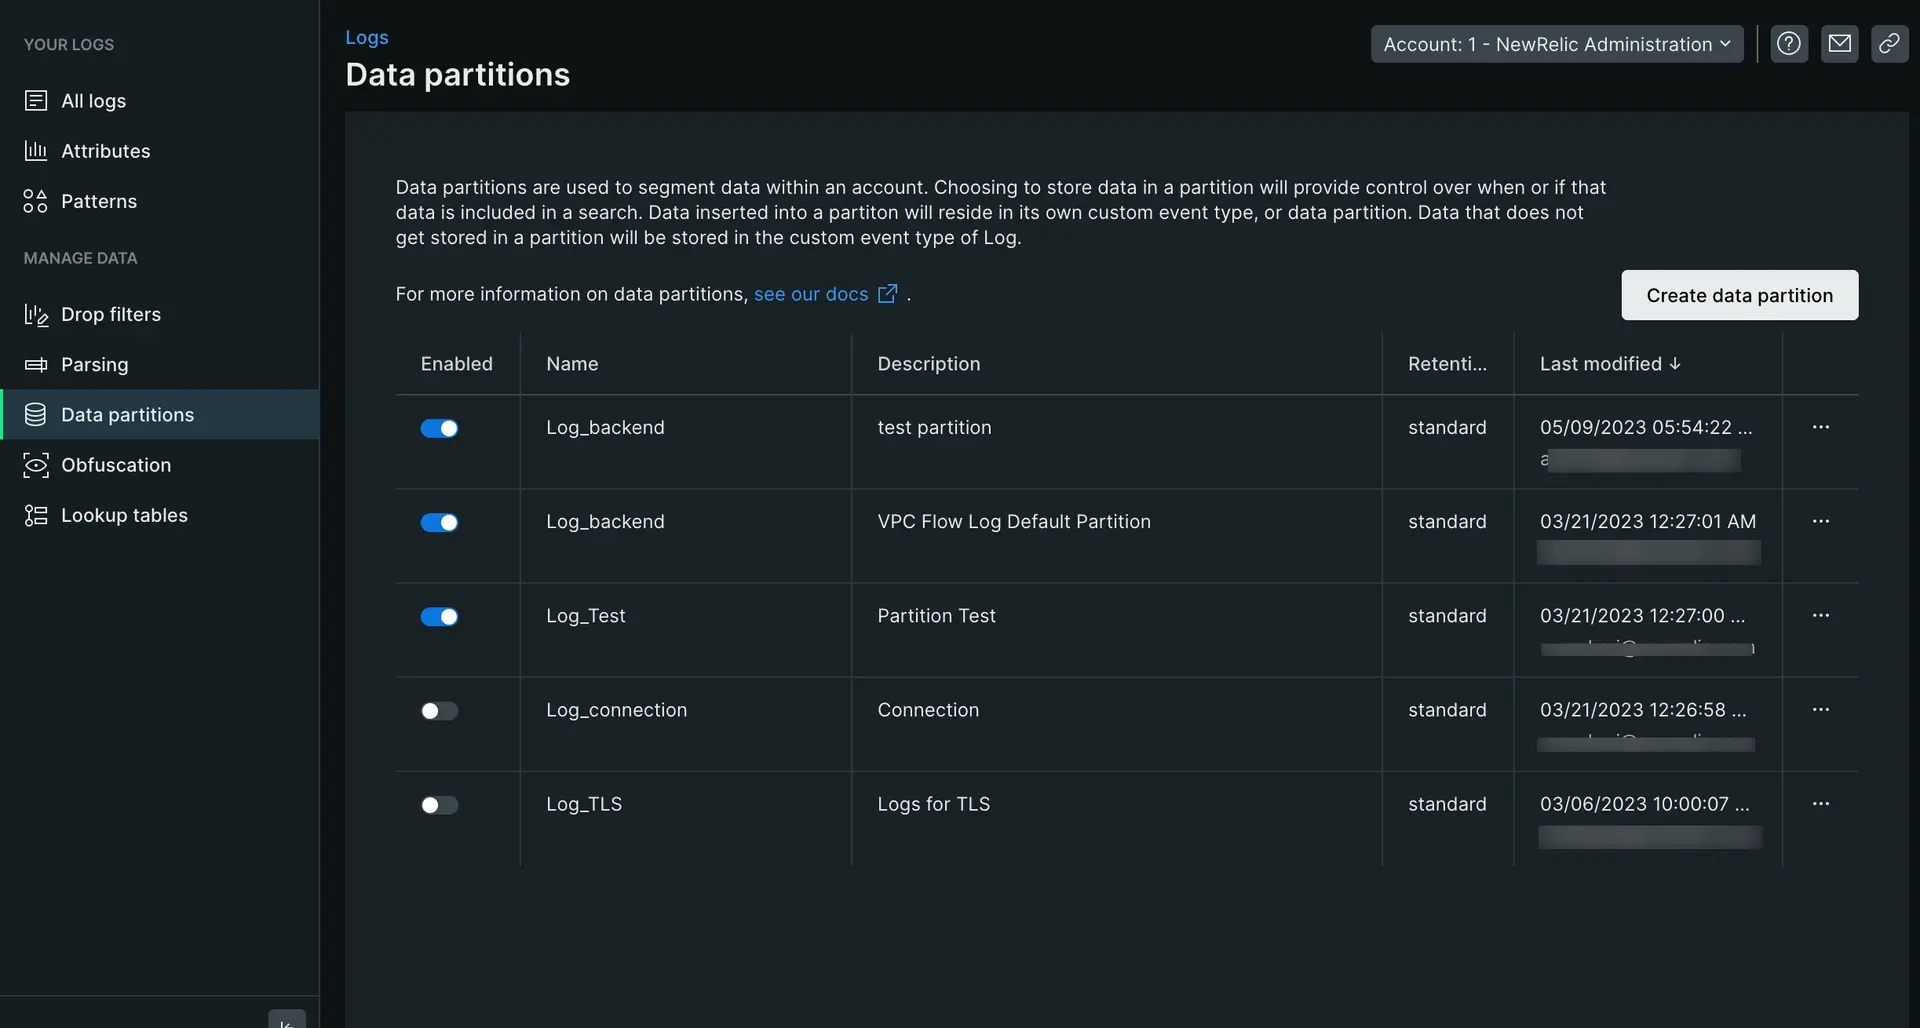
Once you've decided what logs to ingest and store, it's time to organize your logs. You're still likely ingesting hundreds of gigabytes or dozens of terabytes of logs. While it's a lot less than you originally had, you'll still have toil while trying to effectively use them.
To solve this, we'll group these remaining logs into thematic partitions and parse the logs to pull out and tag valuable attributes. By organizing your logs in this manner, you can:
- Query for any attribute within your logs
- Manage specific partitions at a time, such as front-end logs vs back-end logs
- Reduce query load times
Why partition your logs
You can gain significant performance improvements with proper use of data partitions. Organizing your data into discrete partitions enables you to query just the data you need. You can query a single partition or a comma separated list of partitions. The goals of partitioning your data should be to:
- Create data partitions that align with categories in your environment or organization that are static or change infrequently (for example, by business unit, team, environment, service, etc.).
- Create partitions to optimize the number of events that must be scanned for your most common queries. There is no established rule, but generally as scanned log events gets over 500 million (especially over 1 billion) for your
commonqueries, you may consider adjusting your partitioning.
A partition's namespace determines its retention period. We offer two retention options:
- Standard: The account's default retention determined by your New Relic subscription. This is the maximum retention period available in your account and is the namespace you'll select for most of your partitions.
- Secondary: 30-day retention. All logs sent to a partition that's a member of the secondary namespace will be purged on a rolling basis 30 days after having been ingested.
Why parse logs
Parsing your logs at ingest is the best way to make your log data more usable by you and other users in your organization. For example, compare these two logs pre-parsing and post-parsing using a Grok parsing rule:
Pre-parsing:
{ "message": "32 4329 store_Portland"}Post-parsing:
{ "transaction_total": "32", "purchase_number": "4329", "store_location": "store_Portland"}This allows you to easily query for newly defined attributes such as transaction_total in dashboards and alerts.
Organize your logs
Let's say ACME Corp knows they will ingest about 2 TBs of logs in the coming months. They want to create partitions for logs coming from their Java app and from their infrastructure agent. They think they may need to query their Java logs far into the future so they decide to use a standard retention. Meanwhile, they only need recent infrastructure logs so they will use secondary retention for those.
To do so:
Navigate to the UI
Go to one.newrelic.com > Logs
Partition your logs
- From Manage data on the left nav, click Data partitions, then click Create partition rule.
- Define a partition name as an alphanumeric string that begins with
Log_. In this caseLog_java. - Add an optional description.
- Select the standard namespace retention for the partition.
- Set your rule's matching criteria: Enter a valid NRQL
WHEREclause to match the logs to store in this partition. In this caselogtype=java. - Click Create to save your new partition.
This creates a data partition with standard data retention for all Java logs. To organize your infrastruture logs, you would follow the same steps above, only changing the retention to secondary and query to logtype=infrastructure.
Parse your logs
Now that your logs are partitioned, it's time to parse them. Parsing them allows you to pull out releveant data within your logs for easier querying and accessability.
To parse your logs:
- From Manage Data on the left nav of the logs UI, click Parsing, then click Create parsing rule.
- Enter a name for the new parsing rule.
- Select an existing field to parse (the default is
message), or enter a new field name. - Enter a valid NRQL
WHEREclause to match the logs you want to parse. - Select a matching log if one exists, or click on the paste log tab to paste in a sample log.
- Enter the parsing rule and validate it's working by viewing the results in the Output section. (See example below)
- Enable and save the custom parsing rule.
The following example guides you through a specific example of creating a parsing rule:
For a more in-depth look at creating Grok patterns to parse logs, read our blog post.
What's next
Congratulations on uncovering the true value of your logs and saving your team hours of frustration with your logs! As your system grows and you ingest, you'll need to ensure an upkeep of parsing rules and partitions. If you're interested in diving deeper on what New Relic can do for you, check out these docs:
- Parsing log data: A deeper look into parsing logs with Grok and learn how to create, query, and manage your log parsing rules by using NerdGraph, our GraphQL API.
- Log patterns: Log patterns are the fastest way to discover value in log data without searching.
- Log obfuscation: With log obfuscation rules, you can prevent certain types of information from being saved in New Relic.
- Find data in long logs (blobs): Extensive log data can help you troubleshoot issues. But what if an attribute in your log contains thousands of characters? How much of this data can New Relic store? And how can you find useful information in all this data?

