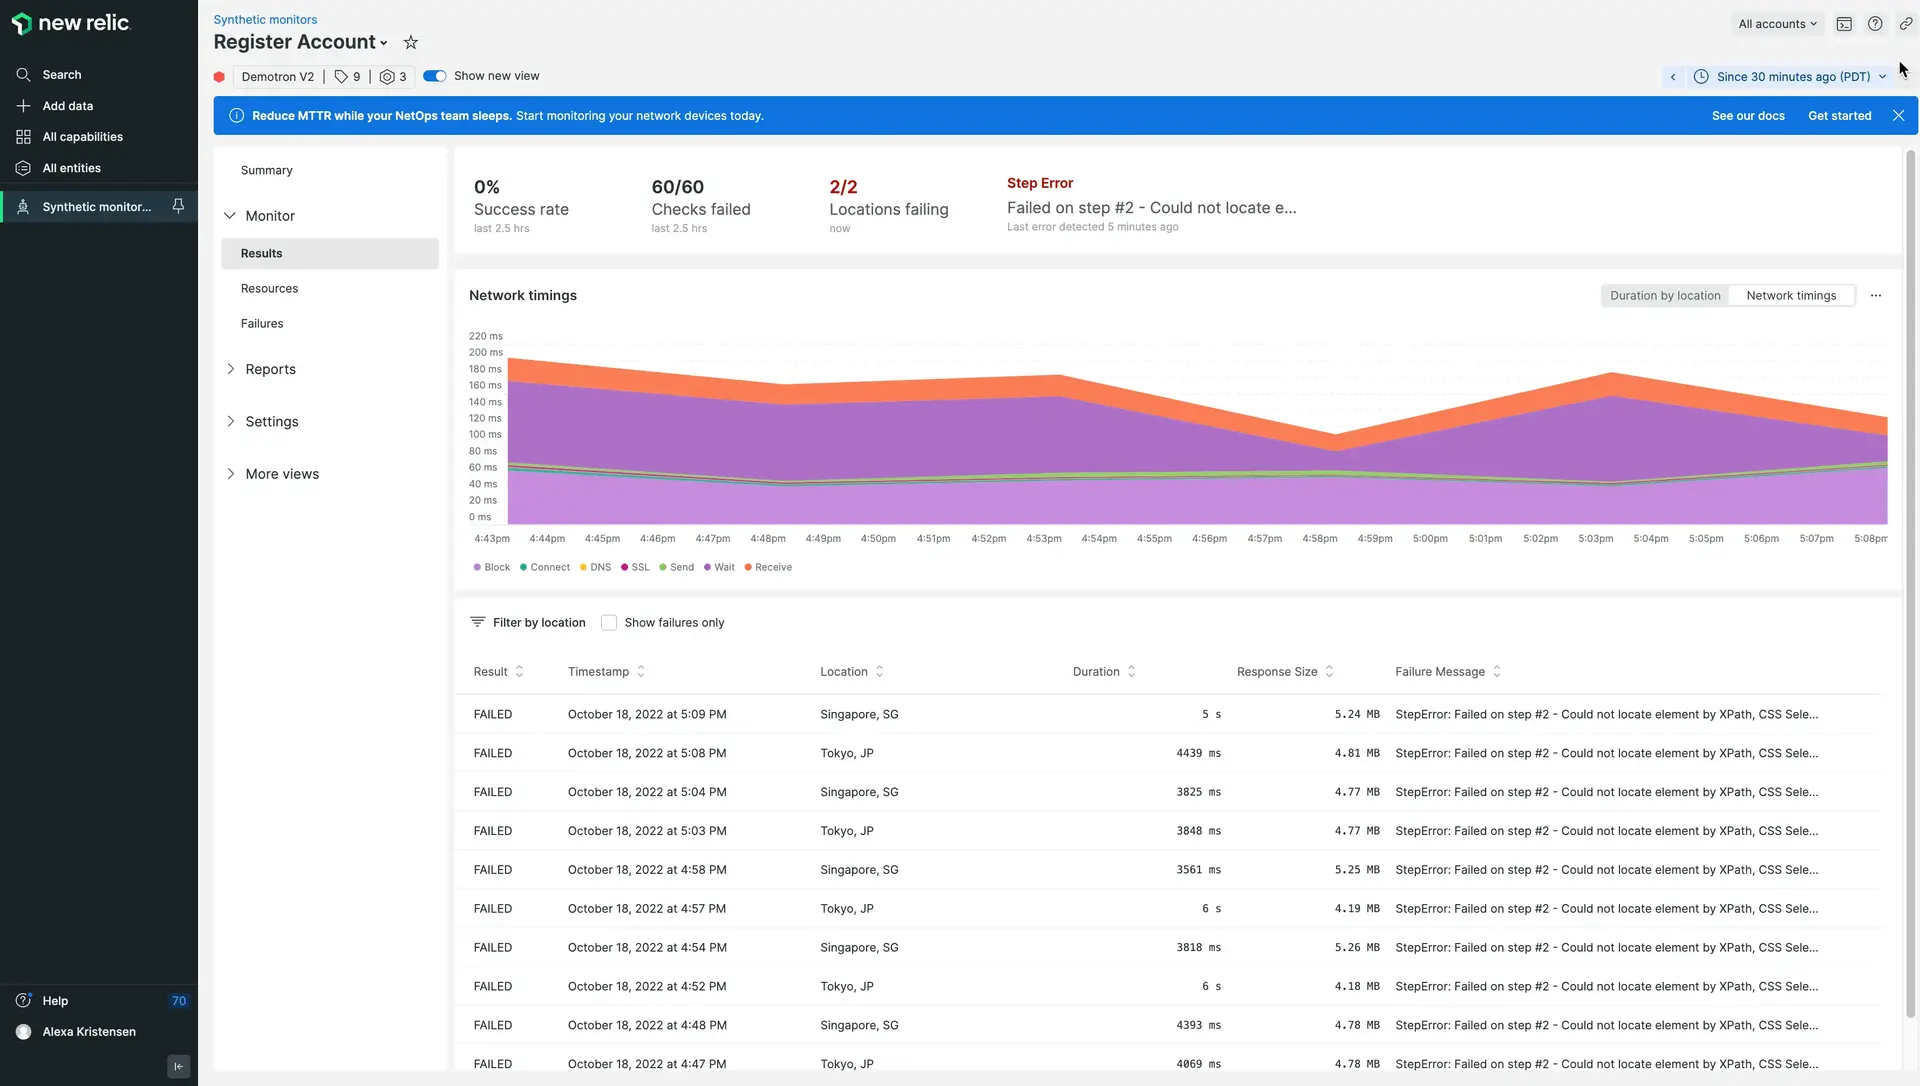
Use the Results page to view individual monitor results. Locate interesting results by sorting the list to identify slow, fast, or other unusual results. Or filter by location to understand how monitor performance varies with geography. The Page Load Time graph gives a snapshot of how page performance has varied over time.
View the Results page
To access your monitor's Results: Go to one.newrelic.com > Synthetic monitoring > (select a monitor) > Results.

one.newrelic.com > Synthetic monitoring > (select a monitor) > Results: Use the Results page to locate interesting runs of your monitor for troubleshooting, and see where your monitors spend the most time.
Use page functions
The Results page supports the following features:
If you want to... | Do this... |
|---|---|
Sort the results list | From the Sort By dropdown, select an option:
|
Filter by location | Select a location label to hide results from that location. Select the location label again to unhide those results. To view results from only one location, hide every other location. |
Hide and unhide chart elements | Select chart elements to hide and unhide them from the Page Load Time chart.  |
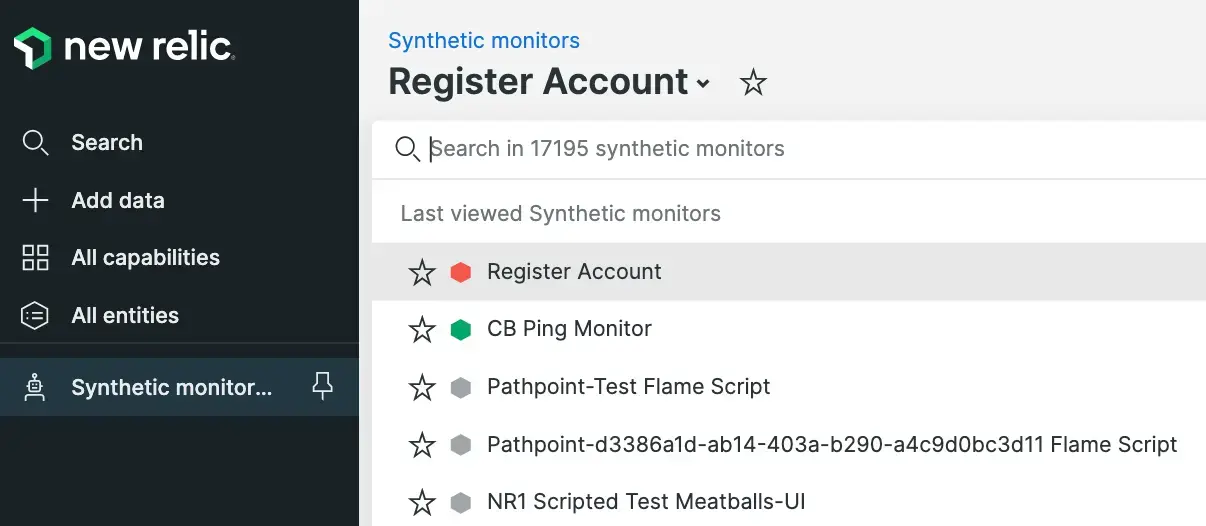
Quickly access another monitor | |
Change the time frame | Use the time picker to adjust the number of results returned. |
