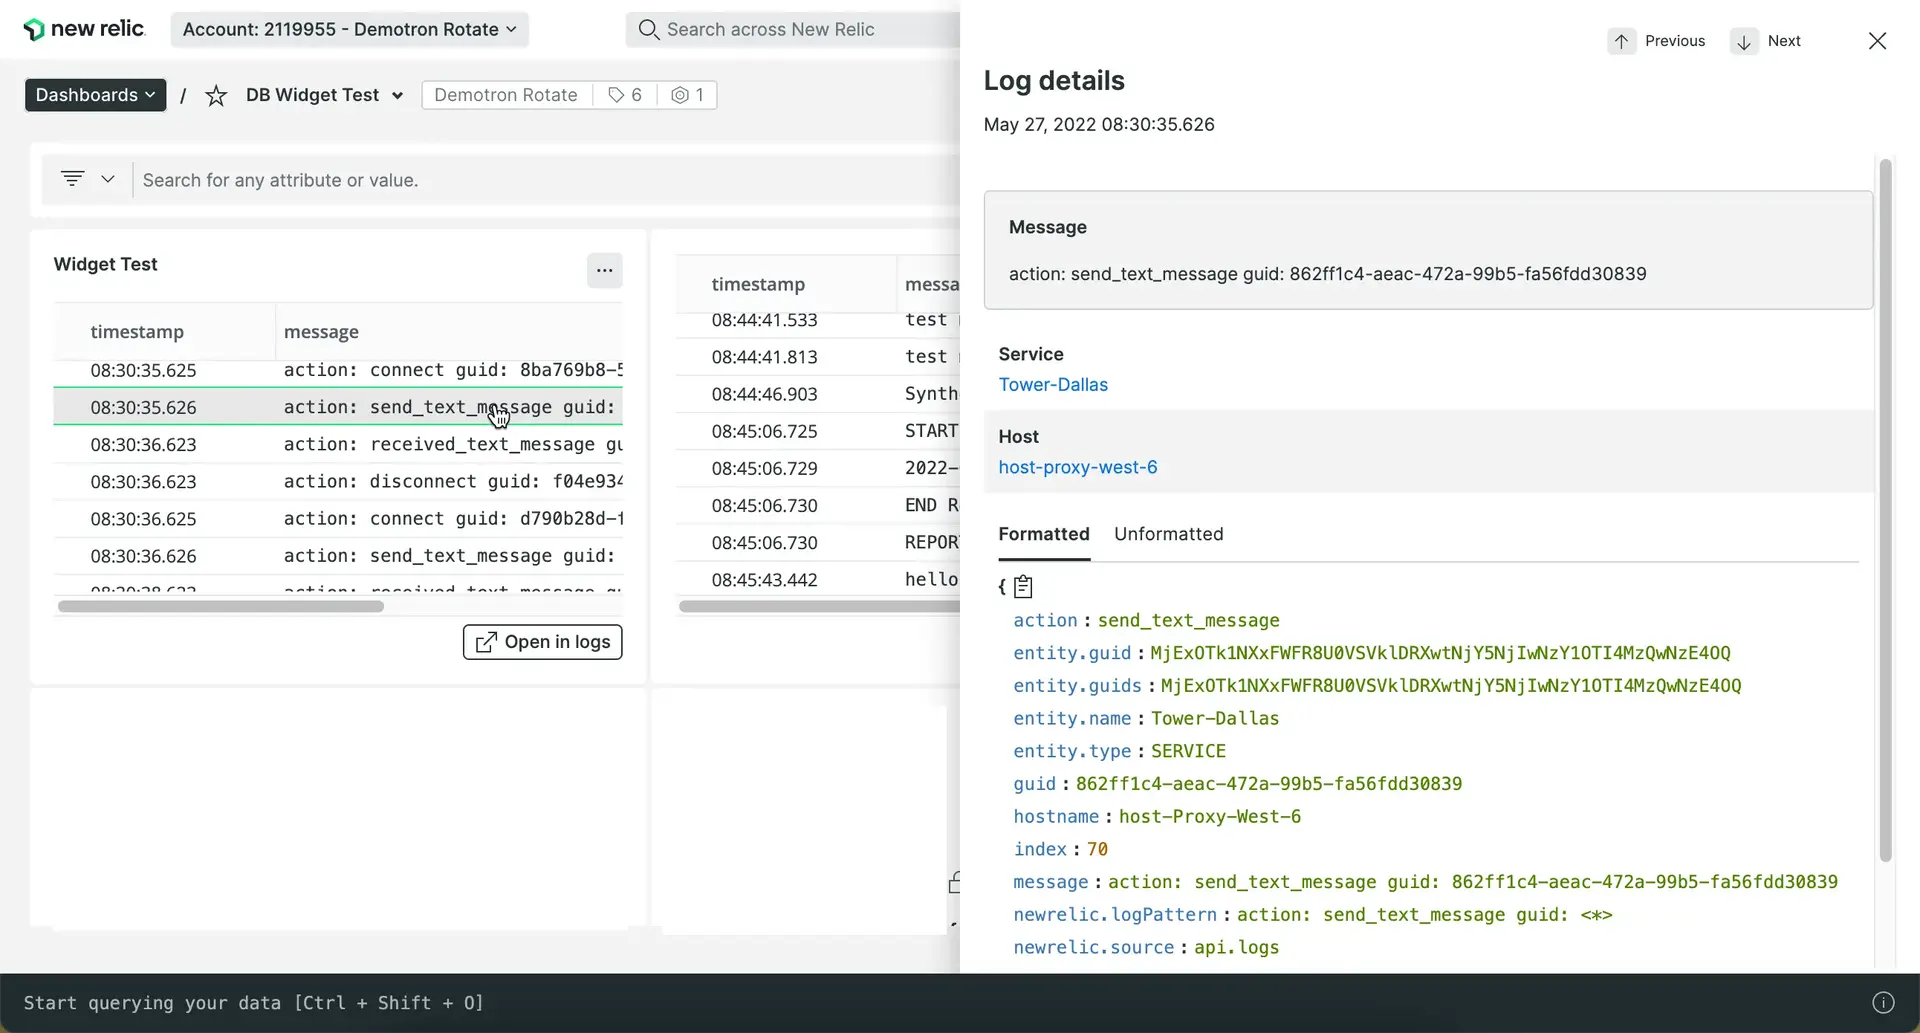
Enhanced functionality for log tables in dashboards
We've made it even easier for you to explore your logs data as table widgets in dashboards. After you create your dashboard, you can:
- Use standard dashboard widget functions, such as copying, editing, deleting, etc.
- Click any log row to show details about it.
- Update your query to add more columns.
- Query log data from other available accounts, and add more charts (for example, as comparative data) to your dashboard.
- Click Open in logs to go directly to the Logs UI for additional troubleshooting.

APM logs in context available for Node.js
APM logs in context is now available for Node.js! (It was also released earlier this month for Java, .NET, and Ruby.) For more information, see our Node.js logs in context procedures for agent v8.11.0 or higher.
If your APM agent doesn't support our automatic logs in context solution yet, you can continue to use our manual logs in context solutions, and forward your logs via our infrastructure agent or supported third-party forwarder.
Notes
To stay up to date the most recent fixes and enhancements, subscribe to our Logs RSS feed.