---
title: Monitor self-hosted Kafka with OpenTelemetry
source: https://docs.newrelic.com/docs/opentelemetry/integrations/kafka/self-hosted
---
Monitor your self-hosted Apache Kafka cluster by installing the OpenTelemetry Collector directly on Linux hosts. Choose between the OpenTelemetry Java agent or Prometheus JMX Exporter approach to collect JMX metrics from your Kafka brokers.
## Architecture [#architecture-overview]
New Relic supports two approaches for monitoring self-hosted Kafka: the OpenTelemetry Java agent or the Prometheus JMX Exporter. The following diagram illustrates the data flow for each approach.
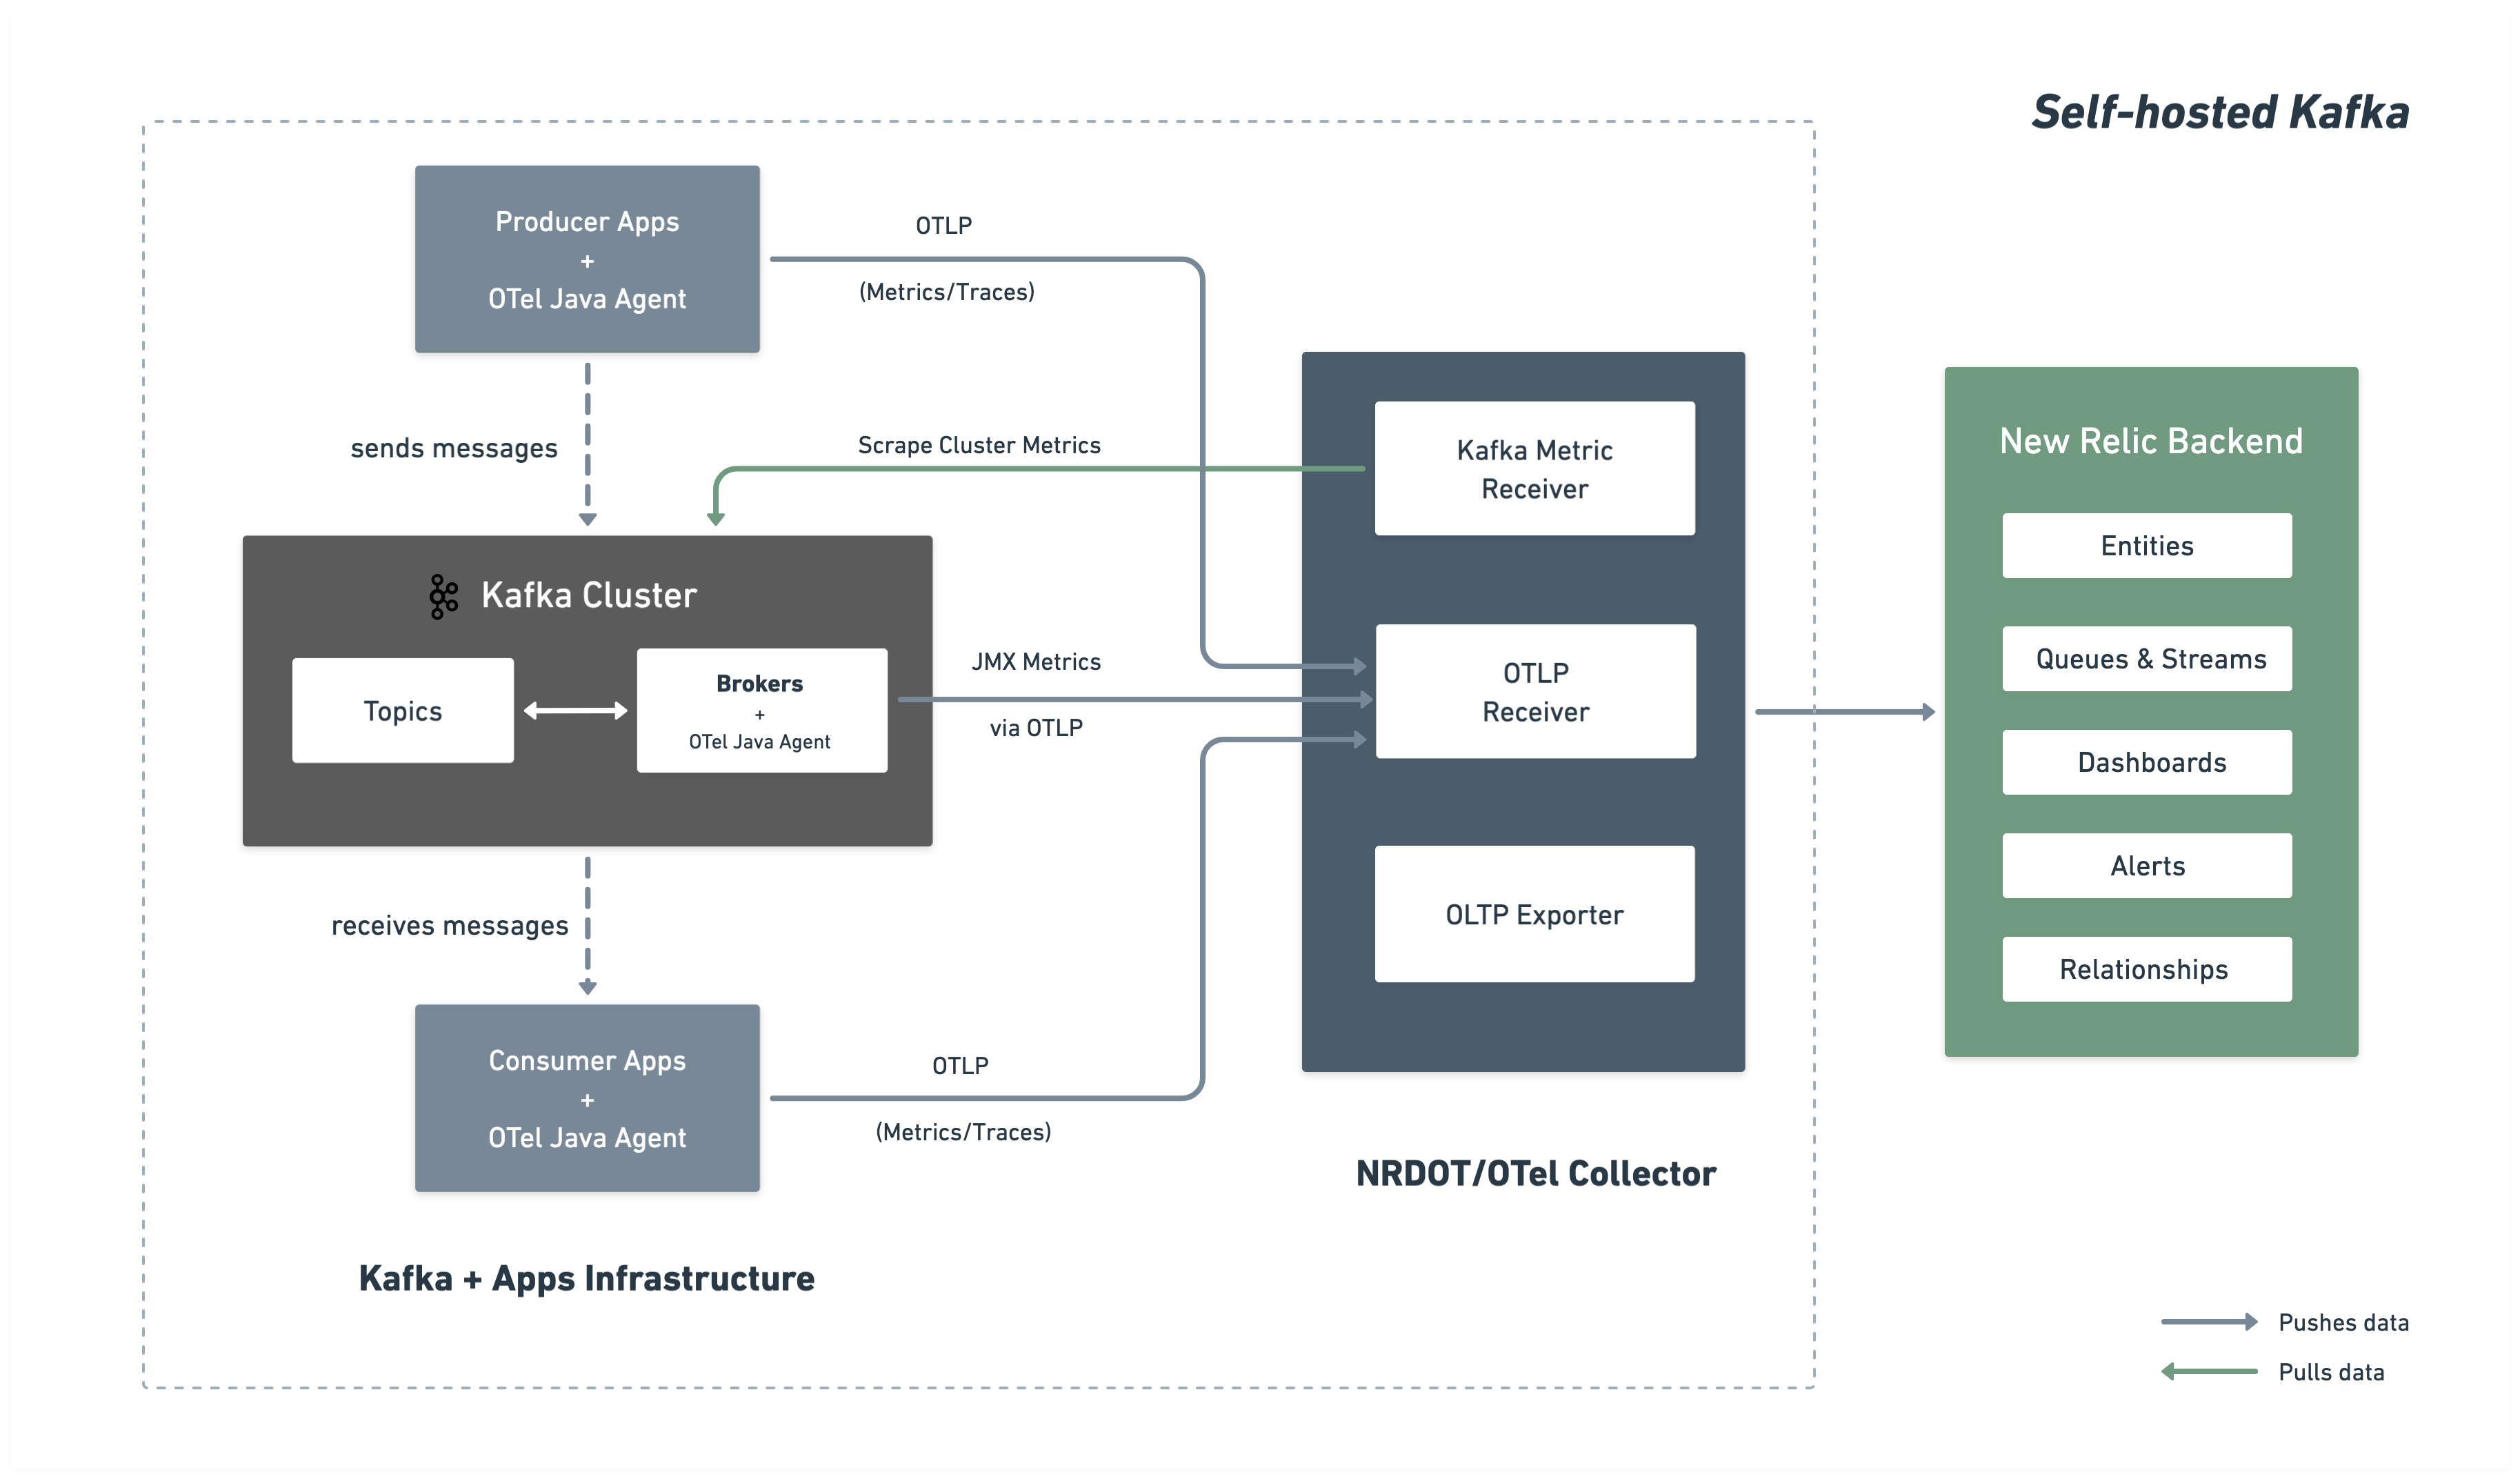
## Installation steps [#installation-steps]
### Via OTel Java agent
Follow these steps to set up comprehensive Kafka monitoring by installing the OpenTelemetry Java agent on your brokers and deploying a collector to gather and send metrics and logs to New Relic.
#### Before you begin [#prerequisites]
Ensure you have:
- A [New Relic account](https://newrelic.com/signup) with a license key
- Network access from the collector to Kafka bootstrap server port (typically 9092)
#### Create collector configuration [#collector-config]
Create the main OpenTelemetry Collector configuration at `~/opentelemetry/collector-kafka-config.yaml` on a monitoring host.
```yaml
receivers:
# OTLP receiver for Kafka and JMX metrics from Java agents and application telemetry
otlp:
protocols:
grpc:
endpoint: "0.0.0.0:4317"
# Kafka metrics receiver for cluster-level metrics
kafkametrics:
brokers: ${env:KAFKA_BOOTSTRAP_BROKER_ADDRESSES}
protocol_version: 2.0.0
scrapers:
- brokers
- topics
- consumers
collection_interval: 30s
# Exclude internal Kafka topics (prefixed with __) at the source
topic_match: "^[^_].*$"
metrics:
kafka.topic.min_insync_replicas:
enabled: true
kafka.topic.replication_factor:
enabled: true
kafka.partition.replicas:
enabled: false
kafka.partition.oldest_offset:
enabled: false
kafka.partition.current_offset:
enabled: false
processors:
batch/aggregation:
send_batch_size: 1024
timeout: 30s
resourcedetection:
detectors: [env, ec2, system]
system:
resource_attributes:
host.name:
enabled: true
host.id:
enabled: true
resource:
attributes:
- action: insert
key: kafka.cluster.name
value: ${env:KAFKA_CLUSTER_NAME}
transform/remove_broker_id:
metric_statements:
# Remove broker.id for cluster-level metrics — these represent the whole cluster,
# not a specific broker. broker.id is retained on broker-level metrics pipelines.
- context: resource
statements:
- delete_key(attributes, "broker.id")
transform/remove_extra_attributes:
metric_statements:
- context: resource
statements:
# Delete all attributes starting with "process."
- delete_matching_keys(attributes, "^process\\..*")
# Delete all attributes starting with "telemetry."
- delete_matching_keys(attributes, "^telemetry\\..*")
- delete_key(attributes, "host.arch")
- delete_key(attributes, "os.description")
- delete_key(attributes, "host.image.id")
- delete_key(attributes, "host.type")
- delete_matching_keys(attributes, "^cloud\\..*")
- delete_key(attributes, "service.instance.id") where IsMatch(attributes["service.name"], "^unknown_service:")
- delete_key(attributes, "service.name") where IsMatch(attributes["service.name"], "^unknown_service:")
# Filter internal Kafka topics as a safety net (kafkametrics topic_match handles the receiver side)
filter/internal_topics:
metrics:
datapoint:
- 'attributes["topic"] != nil and IsMatch(attributes["topic"], "^__.*")'
filter/include_cluster_metrics:
metrics:
include:
match_type: regexp
metric_names:
- "kafka\\.partition\\.offline"
- "kafka\\.(leader|unclean)\\.election\\.rate"
- "kafka\\.partition\\.non_preferred_leader"
- "kafka\\.broker\\.fenced\\.count"
- "kafka\\.cluster\\.partition\\.count"
- "kafka\\.cluster\\.topic\\.count"
filter/exclude_cluster_metrics:
metrics:
exclude:
match_type: regexp
metric_names:
- "kafka\\.partition\\.offline"
- "kafka\\.(leader|unclean)\\.election\\.rate"
- "kafka\\.partition\\.non_preferred_leader"
- "kafka\\.broker\\.fenced\\.count"
- "kafka\\.cluster\\.partition\\.count"
- "kafka\\.cluster\\.topic\\.count"
transform/des_units:
metric_statements:
- context: metric
statements:
- set(description, "") where description != ""
- set(unit, "") where unit != ""
cumulativetodelta:
metricstransform/kafka_topic_sum_aggregation:
transforms:
- include: kafka.partition.replicas_in_sync
action: insert
new_name: kafka.partition.replicas_in_sync.total
operations:
- action: aggregate_labels
label_set: [topic]
aggregation_type: sum
- include: kafka.partition.replicas
action: insert
new_name: kafka.partition.replicas.total
operations:
- action: aggregate_labels
label_set: [topic]
aggregation_type: sum
filter/remove_partition_level_replicas:
metrics:
exclude:
match_type: strict
metric_names:
- kafka.partition.replicas_in_sync
groupbyattrs/cluster:
keys: [kafka.cluster.name]
metricstransform/cluster_max:
transforms:
- include: "kafka\\.partition\\.offline|kafka\\.leader\\.election\\.rate|kafka\\.unclean\\.election\\.rate|kafka\\.partition\\.non_preferred_leader|kafka\\.broker\\.fenced\\.count|kafka\\.cluster\\.partition\\.count|kafka\\.cluster\\.topic\\.count"
match_type: regexp
action: update
operations:
- action: aggregate_labels
aggregation_type: max
label_set: []
exporters:
otlp/newrelic:
endpoint: ${env:NEW_RELIC_OTLP_ENDPOINT}
headers:
api-key: ${env:NEW_RELIC_LICENSE_KEY}
compression: gzip
timeout: 30s
service:
pipelines:
# Broker metrics pipeline (excludes cluster-level metrics)
metrics/broker:
receivers: [otlp, kafkametrics]
processors:
- resourcedetection
- resource
- filter/exclude_cluster_metrics
- filter/internal_topics
- transform/remove_extra_attributes
- transform/des_units
- cumulativetodelta
- metricstransform/kafka_topic_sum_aggregation
- filter/remove_partition_level_replicas
- batch/aggregation
exporters: [otlp/newrelic]
# Cluster metrics pipeline (controller-emitted metrics like offline partitions, topic/partition counts — no broker.id)
metrics/cluster:
receivers: [otlp]
processors:
- resourcedetection
- resource
- filter/include_cluster_metrics
- transform/remove_broker_id
- transform/remove_extra_attributes
- transform/des_units
- cumulativetodelta
- groupbyattrs/cluster
- metricstransform/cluster_max
- batch/aggregation
exporters: [otlp/newrelic]
# APM traces pipeline (producer + consumer spans via OTel Java agent)
traces/apps:
receivers: [otlp]
processors: [resourcedetection, resource, batch/aggregation]
exporters: [otlp/newrelic]
# APM logs pipeline (producer + consumer logs via OTel Java agent)
logs/apps:
receivers: [otlp]
processors: [resourcedetection, resource, batch/aggregation]
exporters: [otlp/newrelic]
```
**Configuration notes**
**Architecture highlights:**
- **OTLP receiver**: Receives Kafka and JMX metrics from OpenTelemetry Java agent running on Kafka brokers via gRPC on port 4317
- **Two pipelines approach**: Cluster-level metrics are sent without broker.id to map to cluster entity
- **Metric filtering**: Separates broker-specific metrics from cluster-level metrics to avoid duplication
- **Aggregation**: Automatically aggregates partition-level metrics by topic
**Additional receiver documentation**
For advanced configuration options, refer to these receiver documentation pages:
- [OTLP receiver documentation](https://github.com/open-telemetry/opentelemetry-collector/tree/main/receiver/otlpreceiver) - OTLP receiver configuration options
- [Kafka metrics receiver documentation](https://github.com/open-telemetry/opentelemetry-collector-contrib/tree/main/receiver/kafkametricsreceiver) - Additional Kafka metrics configuration
#### Set environment variables [#env-vars]
Set the required environment variables on the monitoring host before installing the collector:
```bash
export NEW_RELIC_LICENSE_KEY="YOUR_LICENSE_KEY"
export KAFKA_CLUSTER_NAME="my-kafka-cluster"
export KAFKA_BOOTSTRAP_BROKER_ADDRESSES="broker1-host:9092,broker2-host:9092,broker3-host:9092"
export NEW_RELIC_OTLP_ENDPOINT="https://otlp.nr-data.net:4317" # US region (default)
# EU region: https://otlp.eu01.nr-data.net:4317
# JP region: https://otlp.jp.nr-data.net:4317
```
##### Configuration parameters
The following table describes the key configuration parameters:
| Variable | Description |
| ---------------------------------- | --------------------------------------------------------------------------------------------------------------------------------------------------------------------------------------------------------------------------------------------------------------------------------------------------------------------------------------------------------------------------------------- |
| `NEW_RELIC_LICENSE_KEY` | Your New Relic license key, for example `YOUR_LICENSE_KEY` |
| `KAFKA_CLUSTER_NAME` | A unique name for your Kafka cluster, for example `my-kafka-cluster` |
| `KAFKA_BOOTSTRAP_BROKER_ADDRESSES` | Your Kafka bootstrap broker addresses, for example `broker1-host:9092,broker2-host:9092,broker3-host:9092` |
| `NEW_RELIC_OTLP_ENDPOINT` | OTLP ingest endpoint. Use `https://otlp.nr-data.net:4317` for the US region (default), `https://otlp.eu01.nr-data.net:4317` for the EU region, or `https://otlp.jp.nr-data.net:4317` for the JP region. For other configurations, see [Configure your OTLP endpoint](https://docs.newrelic.com/docs/opentelemetry/best-practices/opentelemetry-otlp/#configure-endpoint-port-protocol). |
#### Install and start the collector [#install-start-collector]
Install and run the collector on the monitoring host. Choose between NRDOT Collector (New Relic's distribution) or OpenTelemetry Collector:
##### NRDOT Collector
> #### 💡 TIP
>
> **NRDOT Collector** is New Relic's distribution of OpenTelemetry Collector with New Relic support for assistance.
**Step 1. Download and install the binary**
Download and install the NRDOT Collector binary for your host operating system. The example below is for **linux_amd64** architecture:
````bash
# Set version and architecture
NRDOT_VERSION="1.9.0"
ARCH="amd64" # or arm64
# Download and extract
curl "https://github.com/newrelic/nrdot-collector-releases/releases/download/${NRDOT_VERSION}/nrdot-collector_${NRDOT_VERSION}_linux_${ARCH}.tar.gz" \
--location --output collector.tar.gz
tar -xzf collector.tar.gz
# Move to a location in PATH (optional)
sudo mv nrdot-collector /usr/local/bin/
# Verify installation
nrdot-collector --version
```
For other operating systems and architectures, visit [NRDOT Collector releases](https://github.com/newrelic/nrdot-collector-releases/releases/latest) and download the appropriate binary for your system.
**Step 2. Start the collector**
Run the collector with your configuration file to begin monitoring:
```bash
nrdot-collector --config ~/opentelemetry/collector-kafka-config.yaml
```
The collector is now running and ready to receive data. Complete the remaining steps to attach the Java agent to your Kafka brokers before metrics appear in New Relic.
````
##### OpenTelemetry Collector
**Step 1. Download and install the binary**
Download and install the OpenTelemetry Collector Contrib binary for your host operating system. The example below is for **linux_amd64** architecture:
````bash
# Set version and architecture
# Check https://github.com/open-telemetry/opentelemetry-collector-releases/releases/latest for the latest version
OTEL_VERSION=""
ARCH="amd64"
# Download the collector
curl -L -o otelcol-contrib.tar.gz \
"https://github.com/open-telemetry/opentelemetry-collector-releases/releases/download/v${OTEL_VERSION}/otelcol-contrib_${OTEL_VERSION}_linux_${ARCH}.tar.gz"
# Extract the binary
tar -xzf otelcol-contrib.tar.gz
# Move to a location in PATH (optional)
sudo mv otelcol-contrib /usr/local/bin/
# Verify installation
otelcol-contrib --version
```
For other operating systems, visit the [OpenTelemetry Collector releases](https://github.com/open-telemetry/opentelemetry-collector-releases/releases/latest) page.
**Step 2. Start the collector**
Run the collector with your configuration file to begin monitoring:
```bash
otelcol-contrib --config ~/opentelemetry/collector-kafka-config.yaml
```
The collector is now running and ready to receive data. Complete the remaining steps to attach the Java agent to your Kafka brokers before metrics appear in New Relic.
````
#### Download the OpenTelemetry Java agent [#download-java-agent]
> #### ⚠️ IMPORTANT
>
> Ensure your OpenTelemetry Collector is running before you (re)start Kafka brokers with the Java agent attached. The agent begins sending metrics immediately on broker startup, so the collector must be available to receive them.
The [OpenTelemetry Java agent](https://opentelemetry.io/docs/zero-code/java/agent/) runs as a Java agent attached to your Kafka brokers, collecting Kafka and JMX metrics and sending them via OTLP to the collector:
```bash
# Create directory for OpenTelemetry components
mkdir -p ~/opentelemetry
# Download OpenTelemetry Java agent
curl -L -o ~/opentelemetry/opentelemetry-javaagent.jar \
https://github.com/open-telemetry/opentelemetry-java-instrumentation/releases/latest/download/opentelemetry-javaagent.jar
```
#### Create JMX custom configuration [#jmx-config]
Create an OpenTelemetry Java agent JMX configuration file to collect Kafka metrics from JMX MBeans.
Create the file `~/opentelemetry/kafka-jmx-config.yaml` on each broker host with the following configuration:
```yaml
---
rules:
# Per-topic custom metrics using custom MBean commands
- bean: kafka.server:type=BrokerTopicMetrics,name=MessagesInPerSec,topic=*
metricAttribute:
topic: param(topic)
mapping:
Count:
metric: kafka.prod.msg.count
type: counter
desc: The number of messages per topic
unit: "{message}"
- bean: kafka.server:type=BrokerTopicMetrics,name=BytesInPerSec,topic=*
metricAttribute:
topic: param(topic)
direction: const(in)
mapping:
Count:
metric: kafka.topic.io
type: counter
desc: The bytes received or sent per topic
unit: By
- bean: kafka.server:type=BrokerTopicMetrics,name=BytesOutPerSec,topic=*
metricAttribute:
topic: param(topic)
direction: const(out)
mapping:
Count:
metric: kafka.topic.io
type: counter
desc: The bytes received or sent per topic
unit: By
# Cluster-level metrics using controller-based MBeans
- bean: kafka.controller:type=KafkaController,name=GlobalTopicCount
mapping:
Value:
metric: kafka.cluster.topic.count
type: gauge
desc: The total number of global topics in the cluster
unit: "{topic}"
- bean: kafka.controller:type=KafkaController,name=GlobalPartitionCount
mapping:
Value:
metric: kafka.cluster.partition.count
type: gauge
desc: The total number of global partitions in the cluster
unit: "{partition}"
- bean: kafka.controller:type=KafkaController,name=FencedBrokerCount
mapping:
Value:
metric: kafka.broker.fenced.count
type: gauge
desc: The number of fenced brokers in the cluster
unit: "{broker}"
- bean: kafka.controller:type=KafkaController,name=PreferredReplicaImbalanceCount
mapping:
Value:
metric: kafka.partition.non_preferred_leader
type: gauge
desc: The count of topic partitions for which the leader is not the preferred leader
unit: "{partition}"
# Broker-level metrics using ReplicaManager MBeans
- bean: kafka.server:type=ReplicaManager,name=UnderMinIsrPartitionCount
mapping:
Value:
metric: kafka.partition.under_min_isr
type: gauge
desc: The number of partitions where the number of in-sync replicas is less than the minimum
unit: "{partition}"
# Broker uptime metric using JVM Runtime
- bean: java.lang:type=Runtime
mapping:
Uptime:
metric: kafka.broker.uptime
type: gauge
desc: Broker uptime in milliseconds
unit: ms
# Leader count per broker
- bean: kafka.server:type=ReplicaManager,name=LeaderCount
mapping:
Value:
metric: kafka.broker.leader.count
type: gauge
desc: Number of partitions for which this broker is the leader
unit: "{partition}"
# JVM metrics
- bean: java.lang:type=GarbageCollector,name=*
mapping:
CollectionCount:
metric: jvm.gc.collections.count
type: counter
unit: "{collection}"
desc: total number of collections that have occurred
metricAttribute:
name: param(name)
- bean: java.lang:type=Memory
unit: By
prefix: jvm.memory.
dropNegativeValues: true
mapping:
HeapMemoryUsage.max:
metric: heap.max
desc: current heap usage
type: gauge
HeapMemoryUsage.used:
metric: heap.used
desc: current heap usage
type: gauge
- bean: java.lang:type=Threading
mapping:
ThreadCount:
metric: jvm.thread.count
type: gauge
unit: "{thread}"
desc: Total thread count (Kafka typical range 100-300 threads)
- bean: java.lang:type=OperatingSystem
prefix: jvm.
dropNegativeValues: true
mapping:
SystemCpuLoad:
metric: system.cpu.utilization
type: gauge
unit: '1'
desc: Recent CPU utilization for whole system (0.0 to 1.0)
- bean: kafka.server:type=BrokerTopicMetrics,name=MessagesInPerSec
mapping:
Count:
metric: kafka.message.count
type: counter
desc: The number of messages received by the broker
unit: "{message}"
- bean: kafka.server:type=BrokerTopicMetrics,name=TotalFetchRequestsPerSec
metricAttribute:
type: const(fetch)
mapping:
Count:
metric: &metric kafka.request.count
type: &type counter
desc: &desc The number of requests received by the broker
unit: &unit "{request}"
- bean: kafka.server:type=BrokerTopicMetrics,name=TotalProduceRequestsPerSec
metricAttribute:
type: const(produce)
mapping:
Count:
metric: *metric
type: *type
desc: *desc
unit: *unit
- bean: kafka.server:type=BrokerTopicMetrics,name=FailedFetchRequestsPerSec
metricAttribute:
type: const(fetch)
mapping:
Count:
metric: &metric kafka.request.failed
type: &type counter
desc: &desc The number of requests to the broker resulting in a failure
unit: &unit "{request}"
- bean: kafka.server:type=BrokerTopicMetrics,name=FailedProduceRequestsPerSec
metricAttribute:
type: const(produce)
mapping:
Count:
metric: *metric
type: *type
desc: *desc
unit: *unit
- beans:
- kafka.network:type=RequestMetrics,name=TotalTimeMs,request=Produce
- kafka.network:type=RequestMetrics,name=TotalTimeMs,request=FetchConsumer
- kafka.network:type=RequestMetrics,name=TotalTimeMs,request=FetchFollower
metricAttribute:
type: param(request)
unit: ms
mapping:
99thPercentile:
metric: kafka.request.time.99p
type: gauge
desc: The 99th percentile time the broker has taken to service requests
- bean: kafka.network:type=RequestChannel,name=RequestQueueSize
mapping:
Value:
metric: kafka.request.queue
type: gauge
desc: Size of the request queue
unit: "{request}"
- bean: kafka.server:type=BrokerTopicMetrics,name=BytesInPerSec
metricAttribute:
direction: const(in)
mapping:
Count:
metric: &metric kafka.network.io
type: &type counter
desc: &desc The bytes received or sent by the broker
unit: &unit By
- bean: kafka.server:type=BrokerTopicMetrics,name=BytesOutPerSec
metricAttribute:
direction: const(out)
mapping:
Count:
metric: *metric
type: *type
desc: *desc
unit: *unit
- beans:
- kafka.server:type=DelayedOperationPurgatory,name=PurgatorySize,delayedOperation=Produce
- kafka.server:type=DelayedOperationPurgatory,name=PurgatorySize,delayedOperation=Fetch
metricAttribute:
type: param(delayedOperation)
mapping:
Value:
metric: kafka.purgatory.size
type: gauge
desc: The number of requests waiting in purgatory
unit: "{request}"
- bean: kafka.server:type=ReplicaManager,name=PartitionCount
mapping:
Value:
metric: kafka.partition.count
type: gauge
desc: The number of partitions on the broker
unit: "{partition}"
- bean: kafka.controller:type=KafkaController,name=OfflinePartitionsCount
mapping:
Value:
metric: kafka.partition.offline
type: gauge
desc: The number of partitions offline
unit: "{partition}"
- bean: kafka.server:type=ReplicaManager,name=UnderReplicatedPartitions
mapping:
Value:
metric: kafka.partition.under_replicated
type: gauge
desc: The number of under replicated partitions
unit: "{partition}"
- bean: kafka.server:type=ReplicaManager,name=IsrShrinksPerSec
metricAttribute:
operation: const(shrink)
mapping:
Count:
metric: kafka.isr.operation.count
type: counter
desc: The number of in-sync replica shrink and expand operations
unit: "{operation}"
- bean: kafka.server:type=ReplicaManager,name=IsrExpandsPerSec
metricAttribute:
operation: const(expand)
mapping:
Count:
metric: kafka.isr.operation.count
type: counter
desc: The number of in-sync replica shrink and expand operations
unit: "{operation}"
- bean: kafka.server:type=ReplicaFetcherManager,name=MaxLag,clientId=Replica
mapping:
Value:
metric: kafka.max.lag
type: gauge
desc: The max lag in messages between follower and leader replicas
unit: "{message}"
- bean: kafka.controller:type=KafkaController,name=ActiveControllerCount
mapping:
Value:
metric: kafka.controller.active.count
type: gauge
desc: For KRaft mode, the number of active controllers in the cluster. For ZooKeeper, indicates whether the broker is the controller broker.
unit: "{controller}"
- bean: kafka.controller:type=ControllerStats,name=LeaderElectionRateAndTimeMs
mapping:
Count:
metric: kafka.leader.election.rate
type: counter
desc: The leader election count
unit: "{election}"
- bean: kafka.controller:type=ControllerStats,name=UncleanLeaderElectionsPerSec
mapping:
Count:
metric: kafka.unclean.election.rate
type: counter
desc: Unclean leader election count - increasing indicates broker failures
unit: "{election}"
# ── Additional metrics — remove this section to reduce data ingest ───────────
# Request latency: total count, 50th percentile, and average (99p kept above)
- beans:
- kafka.network:type=RequestMetrics,name=TotalTimeMs,request=Produce
- kafka.network:type=RequestMetrics,name=TotalTimeMs,request=FetchConsumer
- kafka.network:type=RequestMetrics,name=TotalTimeMs,request=FetchFollower
metricAttribute:
type: param(request)
unit: ms
mapping:
Count:
metric: kafka.request.time.total
type: counter
desc: The total time the broker has taken to service requests
50thPercentile:
metric: kafka.request.time.50p
type: gauge
desc: The 50th percentile time the broker has taken to service requests
Mean:
metric: kafka.request.time.avg
type: gauge
desc: The average time the broker has taken to service requests
- bean: kafka.log:type=LogFlushStats,name=LogFlushRateAndTimeMs
unit: ms
type: gauge
prefix: kafka.logs.flush.
mapping:
Count:
metric: count
unit: '{flush}'
type: counter
desc: Log flush count
50thPercentile:
metric: time.50p
desc: Log flush time - 50th percentile
99thPercentile:
metric: time.99p
desc: Log flush time - 99th percentile
# GC elapsed time (cumulative collection time in ms)
- bean: java.lang:type=GarbageCollector,name=*
mapping:
CollectionTime:
metric: jvm.gc.collections.elapsed
type: counter
unit: ms
desc: the approximate accumulated collection elapsed time in milliseconds
metricAttribute:
name: param(name)
# JVM class loading
- bean: java.lang:type=ClassLoading
mapping:
LoadedClassCount:
metric: jvm.class.count
type: gauge
unit: "{class}"
desc: Currently loaded class count
# JVM heap committed (in addition to heap.used and heap.max)
- bean: java.lang:type=Memory
unit: By
prefix: jvm.memory.
dropNegativeValues: true
mapping:
HeapMemoryUsage.committed:
metric: heap.committed
desc: Committed heap memory
type: gauge
# Additional JVM CPU and system metrics
- bean: java.lang:type=OperatingSystem
prefix: jvm.
dropNegativeValues: true
mapping:
SystemLoadAverage:
metric: system.cpu.load_1m
type: gauge
unit: "{run_queue_item}"
desc: System load average (1 minute) - alert if > CPU count
AvailableProcessors:
metric: cpu.count
type: gauge
unit: "{cpu}"
desc: Number of processors available
ProcessCpuLoad:
metric: cpu.recent_utilization
type: gauge
unit: '1'
desc: Recent CPU utilization for JVM process (0.0 to 1.0)
OpenFileDescriptorCount:
metric: file_descriptor.count
type: gauge
unit: "{file_descriptor}"
desc: Number of open file descriptors - alert if > 80% of ulimit
# JVM memory pool breakdown (by generation: G1 Old Gen, Eden, Survivor, etc.)
- bean: java.lang:type=MemoryPool,name=*
type: gauge
unit: By
metricAttribute:
name: param(name)
mapping:
Usage.used:
metric: jvm.memory.pool.used
desc: Memory pool usage by generation (G1 Old Gen, Eden, Survivor)
Usage.max:
metric: jvm.memory.pool.max
desc: Maximum memory pool size
CollectionUsage.used:
metric: jvm.memory.pool.used_after_last_gc
desc: Memory used after last GC (shows retained memory baseline)
```
#### Configure Kafka broker [#configure-broker]
Attach the OpenTelemetry Java agent to your Kafka broker by setting the `KAFKA_OPTS` environment variable before starting Kafka.
**Single broker example**:
```bash
OTEL_AGENT="$HOME/opentelemetry/opentelemetry-javaagent.jar"
JMX_CONFIG="$HOME/opentelemetry/kafka-jmx-config.yaml"
nohup env KAFKA_OPTS="-javaagent:$OTEL_AGENT \
-Dotel.jmx.enabled=true \
-Dotel.jmx.config=$JMX_CONFIG \
-Dotel.resource.attributes=broker.id=1,kafka.cluster.name=my-kafka-cluster \
-Dotel.exporter.otlp.endpoint=http://collector-host-ip:4317 \
-Dotel.exporter.otlp.protocol=grpc \
-Dotel.metrics.exporter=otlp \
-Dotel.logs.exporter=otlp \
-Dotel.instrumentation.runtime-telemetry.enabled=false \
-Dotel.metric.export.interval=30000" \
bin/kafka-server-start.sh config/server.properties &
```
> #### ⚠️ IMPORTANT
>
> **Multi-broker clusters**: For multiple brokers, use the same configuration with unique `broker.id` values (e.g., `broker.id=1`, `broker.id=2`, `broker.id=3`) in the `-Dotel.resource.attributes` parameter for each broker.
> #### 💡 TIP
>
> Broker logs are automatically enabled with the `-Dotel.logs.exporter=otlp` flag above. To disable broker log collection, set `-Dotel.logs.exporter=none` instead.
##### Configuration parameters
The following table describes the key configuration parameters:
| Parameter | Description |
| -------------------- | ----------------------------------------------------------------------------------------------------------------------------- |
| `otlp.endpoint` | Replace with the IP or hostname of the host running your OpenTelemetry Collector, for example `http://collector-host-ip:4317` |
| `broker.id` | Replace `1` with the unique broker ID for each broker, for example `broker.id=1`, `broker.id=2`, `broker.id=3` |
| `kafka.cluster.name` | Replace `my-kafka-cluster` with your Kafka cluster name. Must match the value set in the collector configuration. |
| `logs.exporter` | Enables broker log collection when set to `otlp`. Set to `none` to disable broker log forwarding. |
For complete configuration options, refer to the [Java agent configuration guide](https://opentelemetry.io/docs/zero-code/java/agent/configuration/).
#### (Optional) Instrument producer or consumer applications [#instrument-apps]
> #### ⚠️ IMPORTANT
>
> **Language support**: Currently, only Java applications are supported for Kafka client instrumentation using the OpenTelemetry Java agent.
To collect application-level telemetry from your Kafka producer and consumer applications, download the OpenTelemetry Java agent from the [Download the OpenTelemetry Java agent](#download-java-agent) step above.
Start your application with the agent:
```bash
OTEL_AGENT="$HOME/opentelemetry/opentelemetry-javaagent.jar"
java \
-javaagent:$OTEL_AGENT \
-Dotel.service.name="order-process-service" \
-Dotel.resource.attributes="kafka.cluster.name=my-kafka-cluster" \
-Dotel.exporter.otlp.endpoint=http://collector-host-ip:4317 \
-Dotel.exporter.otlp.protocol="grpc" \
-Dotel.metrics.exporter="otlp" \
-Dotel.traces.exporter="otlp" \
-Dotel.logs.exporter="otlp" \
-Dotel.instrumentation.kafka.experimental-span-attributes="true" \
-Dotel.instrumentation.messaging.experimental.receive-telemetry.enabled="true" \
-Dotel.instrumentation.kafka.producer-propagation.enabled="true" \
-Dotel.instrumentation.kafka.enabled="true" \
-Dotel.instrumentation.runtime-telemetry.enabled="false" \
-jar your-kafka-application.jar
```
##### Configuration parameters
The following table describes the key configuration parameters:
| Parameter | Description |
| -------------------- | ----------------------------------------------------------------------------------------------------------------------------- |
| `service.name` | Replace with a unique name for your producer or consumer application, for example `order-process-service` |
| `kafka.cluster.name` | Replace with the same cluster name used in your collector configuration, for example `my-kafka-cluster` |
| `otlp.endpoint` | Replace with the hostname or IP of the host running your OpenTelemetry Collector, for example `http://collector-host-ip:4317` |
> #### 💡 TIP
>
> The configuration above sends telemetry to an OpenTelemetry Collector running on `collector-host-ip:4317`. If you want a separate collector dedicated to application telemetry, create one with the following configuration:
>
> **Sample collector configuration**
>
> ````yaml
> receivers:
> otlp:
> protocols:
> grpc:
> endpoint: "0.0.0.0:4317"
>
> exporters:
> otlp/newrelic:
> endpoint: https://otlp.nr-data.net:4317
> headers:
> api-key: "${NEW_RELIC_LICENSE_KEY}"
> compression: gzip
> timeout: 30s
>
> service:
> pipelines:
> traces:
> receivers: [otlp]
> exporters: [otlp/newrelic]
> metrics:
> receivers: [otlp]
> exporters: [otlp/newrelic]
> logs:
> receivers: [otlp]
> exporters: [otlp/newrelic]
> ```
>
> ````
The Java agent provides [out-of-the-box Kafka instrumentation](https://opentelemetry.io/docs/zero-code/java/spring-boot-starter/out-of-the-box-instrumentation/) with zero code changes, capturing request latencies, throughput metrics, error rates, and distributed traces.
For advanced configuration, see the [Kafka instrumentation documentation](https://github.com/open-telemetry/opentelemetry-java-instrumentation/tree/main/instrumentation/kafka).
### Via Prometheus JMX Exporter
Follow these steps to set up comprehensive Kafka monitoring by installing the Prometheus JMX Exporter on your brokers and deploying a collector to gather and send metrics to New Relic.
#### Before you begin [#prerequisites-prometheus]
Ensure you have:
- A [New Relic account](https://newrelic.com/signup) with a license key
- Network access from the collector host to each broker on port `9404`
- Network access from the collector to Kafka bootstrap port (typically `9092`)
#### Download the Prometheus JMX Exporter [#download-jmx-exporter]
Download the Prometheus JMX Exporter JAR on each Kafka broker host:
```bash
# Create directory for Prometheus components
mkdir -p ~/opentelemetry
# Download the Prometheus JMX Exporter agent JAR
# Version 1.5.0 is the minimum required version. Check https://github.com/prometheus/jmx_exporter/releases/latest for newer releases.
JMX_EXPORTER_VERSION="1.5.0"
curl -L -o ~/opentelemetry/jmx_prometheus_javaagent.jar \
"https://github.com/prometheus/jmx_exporter/releases/download/${JMX_EXPORTER_VERSION}/jmx_prometheus_javaagent-${JMX_EXPORTER_VERSION}.jar"
```
#### Create JMX metrics configuration [#jmx-config-prometheus]
Create the JMX Exporter configuration file that defines which Kafka metrics to collect. Save as `~/opentelemetry/kafka-jmx-config.yaml` on each broker host:
```yaml
startDelaySeconds: 0
lowercaseOutputName: true
lowercaseOutputLabelNames: true
rules:
# Cluster-level controller metrics
- pattern: 'kafka.controller<>Value'
name: kafka_cluster_topic_count
type: GAUGE
- pattern: 'kafka.controller<>Value'
name: kafka_cluster_partition_count
type: GAUGE
- pattern: 'kafka.controller<>Value'
name: kafka_broker_fenced_count
type: GAUGE
- pattern: 'kafka.controller<>Value'
name: kafka_partition_non_preferred_leader
type: GAUGE
- pattern: 'kafka.controller<>Value'
name: kafka_partition_offline
type: GAUGE
- pattern: 'kafka.controller<>Value'
name: kafka_controller_active_count
type: GAUGE
# Broker-level replica metrics
- pattern: 'kafka.server<>Value'
name: kafka_partition_under_min_isr
type: GAUGE
- pattern: 'kafka.server<>Value'
name: kafka_broker_leader_count
type: GAUGE
- pattern: 'kafka.server<>Value'
name: kafka_partition_count
type: GAUGE
- pattern: 'kafka.server<>Value'
name: kafka_partition_under_replicated
type: GAUGE
- pattern: 'kafka.server<>Count'
name: kafka_isr_operation_count
type: COUNTER
labels:
operation: "shrink"
- pattern: 'kafka.server<>Count'
name: kafka_isr_operation_count
type: COUNTER
labels:
operation: "expand"
- pattern: 'kafka.server<>Value'
name: kafka_max_lag
type: GAUGE
# Broker topic metrics (totals)
- pattern: 'kafka.server<>Count'
name: kafka_message_count
type: COUNTER
- pattern: 'kafka.server<>Count'
name: kafka_request_count
type: COUNTER
labels:
type: "fetch"
- pattern: 'kafka.server<>Count'
name: kafka_request_count
type: COUNTER
labels:
type: "produce"
- pattern: 'kafka.server<>Count'
name: kafka_request_failed
type: COUNTER
labels:
type: "fetch"
- pattern: 'kafka.server<>Count'
name: kafka_request_failed
type: COUNTER
labels:
type: "produce"
- pattern: 'kafka.server<>Count'
name: kafka_network_io
type: COUNTER
labels:
direction: "in"
- pattern: 'kafka.server<>Count'
name: kafka_network_io
type: COUNTER
labels:
direction: "out"
# Per-topic metrics (only appear after traffic flows)
- pattern: 'kafka.server<>Count'
name: kafka_prod_msg_count
type: COUNTER
labels:
topic: "$1"
- pattern: 'kafka.server<>Count'
name: kafka_topic_io
type: COUNTER
labels:
topic: "$1"
direction: "in"
- pattern: 'kafka.server<>Count'
name: kafka_topic_io
type: COUNTER
labels:
topic: "$1"
direction: "out"
# Request metrics
- pattern: 'kafka.network<>99thPercentile'
name: kafka_request_time_99p
type: GAUGE
labels:
type: "$1"
- pattern: 'kafka.network<>Value'
name: kafka_request_queue
type: GAUGE
- pattern: 'kafka.server<>Value'
name: kafka_purgatory_size
type: GAUGE
labels:
type: "$1"
# Controller stats
- pattern: 'kafka.controller<>Count'
name: kafka_leader_election_rate
type: COUNTER
- pattern: 'kafka.controller<>Count'
name: kafka_unclean_election_rate
type: COUNTER
# JVM Garbage Collection
- pattern: 'java.lang<>CollectionCount'
name: jvm_gc_collections_count
type: COUNTER
labels:
name: "$1"
# JVM Memory
- pattern: 'java.langmax'
name: jvm_memory_heap_max
type: GAUGE
- pattern: 'java.langused'
name: jvm_memory_heap_used
type: GAUGE
# JVM Threading and System
- pattern: 'java.lang<>ThreadCount'
name: jvm_thread_count
type: GAUGE
- pattern: 'java.lang<>SystemCpuLoad'
name: jvm_system_cpu_utilization
type: GAUGE
# Broker uptime
- pattern: 'java.lang<>Uptime'
name: kafka_broker_uptime
type: GAUGE
# Additional metrics — remove this section to reduce data ingest
# Request latency: total count, 50th percentile, and average (99p kept above)
- pattern: 'kafka.network<>Count'
name: kafka_request_time_total
type: COUNTER
labels:
type: "$1"
- pattern: 'kafka.network<>50thPercentile'
name: kafka_request_time_50p
type: GAUGE
labels:
type: "$1"
- pattern: 'kafka.network<>Mean'
name: kafka_request_time_avg
type: GAUGE
labels:
type: "$1"
# Log flush metrics
- pattern: 'kafka.log<>Count'
name: kafka_logs_flush_count
type: COUNTER
- pattern: 'kafka.log<>50thPercentile'
name: kafka_logs_flush_time_50p
type: GAUGE
- pattern: 'kafka.log<>99thPercentile'
name: kafka_logs_flush_time_99p
type: GAUGE
# JVM GC elapsed time
- pattern: 'java.lang<>CollectionTime'
name: jvm_gc_collections_elapsed
type: COUNTER
labels:
name: "$1"
# JVM Memory heap committed
- pattern: 'java.langcommitted'
name: jvm_memory_heap_committed
type: GAUGE
# JVM class loading
- pattern: 'java.lang<>LoadedClassCount'
name: jvm_class_count
type: GAUGE
# Additional JVM OS metrics
- pattern: 'java.lang<>SystemLoadAverage'
name: jvm_system_cpu_load_1m
type: GAUGE
- pattern: 'java.lang<>AvailableProcessors'
name: jvm_cpu_count
type: GAUGE
- pattern: 'java.lang<>ProcessCpuLoad'
name: jvm_cpu_recent_utilization
type: GAUGE
- pattern: 'java.lang<>OpenFileDescriptorCount'
name: jvm_file_descriptor_count
type: GAUGE
# JVM Memory Pool
- pattern: 'java.langused'
name: jvm_memory_pool_used
type: GAUGE
labels:
name: "$1"
- pattern: 'java.langmax'
name: jvm_memory_pool_max
type: GAUGE
labels:
name: "$1"
- pattern: 'java.langused'
name: jvm_memory_pool_used_after_last_gc
type: GAUGE
labels:
name: "$1"
```
> #### 💡 TIP
>
> **Customize metrics**: You can add or modify patterns by referencing the [Prometheus JMX Exporter examples](https://github.com/prometheus/jmx_exporter/tree/main/examples) and [Kafka MBean documentation](https://kafka.apache.org/documentation/#monitoring). Refer to the [JMX Exporter rules documentation](https://github.com/prometheus/jmx_exporter/blob/main/docs/content/1.5.0/http-mode/rules.md) for additional configurations.
#### Configure Kafka brokers to use the JMX Exporter [#configure-brokers]
Attach the Prometheus JMX Exporter as a Java agent to each Kafka broker by adding it to your Kafka startup options.
**Single broker example**:
```bash
JMX_JAR="$HOME/opentelemetry/jmx_prometheus_javaagent.jar"
JMX_CONFIG="$HOME/opentelemetry/kafka-jmx-config.yaml"
nohup env KAFKA_OPTS="-javaagent:${JMX_JAR}=9404:${JMX_CONFIG}" \
bin/kafka-server-start.sh config/server.properties &
```
Each broker will now expose Prometheus metrics on port `9404`. Verify:
```bash
curl http://localhost:9404/metrics | grep kafka_
```
> #### ⚠️ IMPORTANT
>
> **Multi-broker clusters**: Apply the same `KAFKA_OPTS` configuration to every broker. Each broker exposes metrics on port `9404` from its own host IP.
#### Create collector configuration [#collector-config-prometheus]
Create the OpenTelemetry Collector configuration at `~/opentelemetry/collector-kafka-config.yaml` on a monitoring host.
The Prometheus receiver scrapes all broker endpoints. The collector listens on `0.0.0.0:4317` for any OTLP data (application traces, logs) in addition to scraping Prometheus endpoints.
```yaml
receivers:
# OTLP receiver for application traces, metrics, and logs (listens on port 4317)
otlp:
protocols:
grpc:
endpoint: "0.0.0.0:4317"
# Prometheus receiver scrapes JMX metrics from Kafka brokers
prometheus/kafka-jmx:
config:
scrape_configs:
- job_name: 'kafka-jmx-metrics'
metrics_path: /metrics
scrape_interval: 30s
static_configs:
# TODO: Replace each target with your broker hostname or IP, and set a unique broker.id per broker
- targets: ['broker1-host:9404']
labels:
broker.id: '0'
- targets: ['broker2-host:9404']
labels:
broker.id: '1'
- targets: ['broker3-host:9404']
labels:
broker.id: '2'
# Kafka metrics receiver for cluster-level consumer lag, topic, and partition metrics
kafkametrics/cluster:
brokers: ${env:KAFKA_BOOTSTRAP_BROKER_ADDRESSES}
protocol_version: 2.0.0
scrapers:
- brokers
- topics
- consumers
collection_interval: 30s
# Exclude internal Kafka topics (prefixed with __) at the source
topic_match: "^[^_].*$"
metrics:
kafka.topic.min_insync_replicas:
enabled: true
kafka.topic.replication_factor:
enabled: true
kafka.partition.replicas:
enabled: false
kafka.partition.oldest_offset:
enabled: false
kafka.partition.current_offset:
enabled: false
exporters:
otlp/backend:
endpoint: ${env:NEW_RELIC_OTLP_ENDPOINT}
headers:
api-key: ${env:NEW_RELIC_LICENSE_KEY}
tls:
insecure: false
sending_queue:
num_consumers: 12
queue_size: 5000
retry_on_failure:
enabled: true
processors:
# Batch processor for efficient export
batch/export:
send_batch_size: 1024
timeout: 30s
# Memory limiter to prevent OOM
memory_limiter:
limit_percentage: 80
spike_limit_percentage: 30
check_interval: 1s
# Transform metric naming conventions (underscore to dot, normalize special names)
transform/metric-naming:
metric_statements:
- context: metric
statements:
- replace_pattern(name, "_", ".")
- replace_pattern(name, "\\.load\\.1", ".load_1")
- replace_pattern(name, "\\.recent\\.util", ".recent_util")
- replace_pattern(name, "file\\.descriptor\\.count", "file_descriptor.count")
- replace_pattern(name, "\\.memory\\.pool\\.used\\.bytes$", ".memory.pool.used")
- replace_pattern(name, "\\.memory\\.pool\\.max\\.bytes$", ".memory.pool.max")
- replace_pattern(name, "\\.memory\\.pool\\.collection\\.used\\.bytes$", ".memory.pool.used_after_last_gc")
- replace_pattern(name, "\\.non\\.preferred\\.leader", ".non_preferred_leader")
- replace_pattern(name, "\\.under\\.min\\.isr", ".under_min_isr")
- replace_pattern(name, "\\.under\\.replicated", ".under_replicated")
- replace_pattern(name, "\\.total$", "") where name != "kafka.request.time.total"
- context: datapoint
statements:
- set(attributes["name"], attributes["gc"]) where attributes["gc"] != nil
- delete_key(attributes, "gc") where attributes["gc"] != nil
- set(attributes["name"], attributes["pool"]) where attributes["pool"] != nil
- delete_key(attributes, "pool") where attributes["pool"] != nil
# Add cluster name to all metrics
resource/cluster-name:
attributes:
- key: kafka.cluster.name
# TODO: Replace with your Kafka cluster name
value: ${env:KAFKA_CLUSTER_NAME}
action: upsert
# Remove broker.id for cluster-level metrics
transform/remove_broker_id:
metric_statements:
- context: datapoint
statements:
- delete_key(attributes, "broker.id")
# Filter out scrape overhead metrics
filter/scrape-overhead:
metrics:
exclude:
match_type: regexp
metric_names:
- "^jmx_.*"
- "^process_.*"
- "^jvm_buffer_pool_.*"
- "^jvm_threads_.*"
- "^jvm_classes_.*"
- "^jvm_memory_(heap|non_heap)_(committed|init|max|used)_bytes$"
- "^jvm_compilation_.*"
- "^jvm_(runtime|info).*"
- "^jvm_memory_pool_(allocated_bytes_total|committed_bytes|init_bytes|collection_(committed|init|max)_bytes)$"
# Include only cluster-level metrics for the cluster pipeline
filter/include_cluster_metrics:
metrics:
include:
match_type: regexp
metric_names:
- "^kafka\\.partition\\.offline$"
- "^kafka\\.(leader|unclean)\\.election\\.rate$"
- "^kafka\\.partition\\.non_preferred_leader$"
- "^kafka\\.broker\\.fenced\\.count$"
- "^kafka\\.cluster\\.partition\\.count$"
- "^kafka\\.cluster\\.topic\\.count$"
# Exclude cluster-level metrics from the broker pipeline
filter/exclude_cluster_metrics:
metrics:
exclude:
match_type: regexp
metric_names:
- "^kafka\\.partition\\.offline$"
- "^kafka\\.(leader|unclean)\\.election\\.rate$"
- "^kafka\\.partition\\.non_preferred_leader$"
- "^kafka\\.broker\\.fenced\\.count$"
- "^kafka\\.cluster\\.partition\\.count$"
- "^kafka\\.cluster\\.topic\\.count$"
# Remove unnecessary attributes
transform/remove_attributes:
metric_statements:
- context: metric
statements:
- set(description, "") where description != ""
- set(unit, "") where unit != ""
- context: resource
statements:
- delete_key(attributes, "server.address")
- delete_key(attributes, "server.port")
- delete_key(attributes, "service.instance.id")
- delete_key(attributes, "host.name")
- delete_key(attributes, "url.scheme")
# Aggregate partition metrics to topic level
metricstransform/topic-aggregation:
transforms:
- include: kafka.partition.replicas_in_sync
action: insert
new_name: kafka.partition.replicas_in_sync.total
operations:
- action: aggregate_labels
label_set: [topic]
aggregation_type: sum
- include: kafka.partition.replicas
action: insert
new_name: kafka.partition.replicas.total
operations:
- action: aggregate_labels
label_set: [topic]
aggregation_type: sum
# Filter out original partition replicas metric
filter/exclude_partition_replicas_metric:
metrics:
exclude:
match_type: strict
metric_names:
- kafka.partition.replicas_in_sync
# Filter internal Kafka topics as a safety net
filter/internal_topics:
metrics:
datapoint:
- 'attributes["topic"] != nil and IsMatch(attributes["topic"], "^__.*")'
# Convert cumulative to delta metrics
cumulativetodelta:
groupbyattrs/cluster:
keys: [kafka.cluster.name]
metricstransform/cluster_max:
transforms:
- include: "kafka\\.partition\\.offline|kafka\\.leader\\.election\\.rate|kafka\\.unclean\\.election\\.rate|kafka\\.partition\\.non_preferred_leader|kafka\\.broker\\.fenced\\.count|kafka\\.cluster\\.partition\\.count|kafka\\.cluster\\.topic\\.count"
match_type: regexp
action: update
operations:
- action: aggregate_labels
aggregation_type: max
label_set: []
service:
pipelines:
# Application traces from instrumented Kafka clients and apps
traces:
receivers: [otlp]
processors: [memory_limiter, batch/export]
exporters: [otlp/backend]
# Application metrics from instrumented Kafka clients and apps
metrics:
receivers: [otlp]
processors: [memory_limiter, batch/export]
exporters: [otlp/backend]
# Application logs from instrumented Kafka clients and apps
logs:
receivers: [otlp]
processors: [memory_limiter, batch/export]
exporters: [otlp/backend]
# Broker-level metrics from Prometheus JMX scraping
metrics/broker:
receivers:
- prometheus/kafka-jmx
processors:
- resource/cluster-name
- filter/scrape-overhead
- transform/metric-naming
- transform/remove_attributes
- filter/exclude_cluster_metrics
- memory_limiter
- cumulativetodelta
- batch/export
exporters:
- otlp/backend
# Cluster-level metrics from Prometheus JMX scraping
metrics/cluster/prometheus:
receivers:
- prometheus/kafka-jmx
processors:
- resource/cluster-name
- filter/scrape-overhead
- transform/metric-naming
- transform/remove_attributes
- filter/include_cluster_metrics
- transform/remove_broker_id
- memory_limiter
- cumulativetodelta
- groupbyattrs/cluster
- metricstransform/cluster_max
- batch/export
exporters:
- otlp/backend
# Cluster-level metrics from Kafka metrics receiver (consumer lag, topics, partitions)
metrics/cluster/kafkametrics:
receivers:
- kafkametrics/cluster
processors:
- resource/cluster-name
- filter/internal_topics
- transform/remove_attributes
- metricstransform/topic-aggregation
- filter/exclude_partition_replicas_metric
- memory_limiter
- cumulativetodelta
- batch/export
exporters:
- otlp/backend
```
**Configuration notes**
**Architecture highlights:**
- **OTLP receiver**: Listens on `0.0.0.0:4317` for application traces, metrics, and logs from instrumented Kafka clients
- **Prometheus receiver**: Scrapes each broker's `/metrics` endpoint on port `9404` using static host targets
- **Kafka metrics receiver**: Connects to the Kafka bootstrap port for consumer lag, topic, and partition metrics not available via JMX
- **Six pipelines**: Application traces/metrics/logs (OTLP), broker metrics, cluster-level JMX metrics (aggregated), and cluster-level Kafka metrics (consumer lag)
- **Metric naming**: Transforms Prometheus `_`-separated names to `.`-separated names matching New Relic dashboards
**Additional receiver documentation**
- [Prometheus receiver documentation](https://github.com/open-telemetry/opentelemetry-collector-contrib/tree/main/receiver/prometheusreceiver) - Additional receiver configuration options
- [Kafka metrics receiver documentation](https://github.com/open-telemetry/opentelemetry-collector-contrib/tree/main/receiver/kafkametricsreceiver) - Additional Kafka metrics configuration
#### Set environment variables [#env-vars-prometheus]
Set the required environment variables on the monitoring host before starting the collector:
```bash
export NEW_RELIC_LICENSE_KEY="YOUR_LICENSE_KEY"
export KAFKA_CLUSTER_NAME="my-kafka-cluster"
export KAFKA_BOOTSTRAP_BROKER_ADDRESSES="broker1-host:9092,broker2-host:9092,broker3-host:9092"
export NEW_RELIC_OTLP_ENDPOINT="https://otlp.nr-data.net:4317" # US region (default)
# EU region: https://otlp.eu01.nr-data.net:4317
# JP region: https://otlp.jp.nr-data.net:4317
```
##### Configuration parameters
The following table describes the key configuration parameters:
| Variable | Description |
| ---------------------------------- | --------------------------------------------------------------------------------------------------------------------------------------------------------------------------------------------------------------------------------------------------------------------------------------------------------------------------------------------------------------------------------------- |
| `NEW_RELIC_LICENSE_KEY` | Your New Relic license key, for example `YOUR_LICENSE_KEY` |
| `KAFKA_CLUSTER_NAME` | A unique name for your Kafka cluster, for example `my-kafka-cluster` |
| `KAFKA_BOOTSTRAP_BROKER_ADDRESSES` | Your Kafka bootstrap broker addresses, for example `broker1-host:9092,broker2-host:9092,broker3-host:9092` |
| `NEW_RELIC_OTLP_ENDPOINT` | OTLP ingest endpoint. Use `https://otlp.nr-data.net:4317` for the US region (default), `https://otlp.eu01.nr-data.net:4317` for the EU region, or `https://otlp.jp.nr-data.net:4317` for the JP region. For other configurations, see [Configure your OTLP endpoint](https://docs.newrelic.com/docs/opentelemetry/best-practices/opentelemetry-otlp/#configure-endpoint-port-protocol). |
#### Install and start the collector [#install-start-collector-prometheus]
Install and run the collector on the monitoring host. Choose between NRDOT Collector (New Relic's distribution) or OpenTelemetry Collector:
##### NRDOT Collector
> #### 💡 TIP
>
> **NRDOT Collector** is New Relic's distribution of OpenTelemetry Collector with New Relic support for assistance. For more information, see the [NRDOT Collector GitHub repository](https://github.com/newrelic/nrdot-collector-releases/tree/main/distributions/nrdot-collector).
**Step 1. Download and install the binary**
````bash
# Set version and architecture
NRDOT_VERSION="1.9.0"
ARCH="amd64" # or arm64
# Download and extract
curl "https://github.com/newrelic/nrdot-collector-releases/releases/download/${NRDOT_VERSION}/nrdot-collector_${NRDOT_VERSION}_linux_${ARCH}.tar.gz" \
--location --output collector.tar.gz
tar -xzf collector.tar.gz
# Move to a location in PATH (optional)
sudo mv nrdot-collector /usr/local/bin/
# Verify installation
nrdot-collector --version
```
For other operating systems and architectures, visit [NRDOT Collector releases](https://github.com/newrelic/nrdot-collector-releases/releases/latest) and download the appropriate binary for your system.
**Step 2. Start the collector**
```bash
nrdot-collector --config ~/opentelemetry/collector-kafka-config.yaml
```
The collector will start scraping Kafka metrics and sending them to New Relic within a few minutes.
````
##### OpenTelemetry Collector
**Step 1. Download and install the binary**
````bash
# Check https://github.com/open-telemetry/opentelemetry-collector-releases/releases/latest for the latest version
OTEL_VERSION=""
ARCH="amd64"
curl -L -o otelcol-contrib.tar.gz \
"https://github.com/open-telemetry/opentelemetry-collector-releases/releases/download/v${OTEL_VERSION}/otelcol-contrib_${OTEL_VERSION}_linux_${ARCH}.tar.gz"
tar -xzf otelcol-contrib.tar.gz
sudo mv otelcol-contrib /usr/local/bin/
otelcol-contrib --version
```
For other operating systems, visit the [OpenTelemetry Collector releases](https://github.com/open-telemetry/opentelemetry-collector-releases/releases/latest) page.
**Step 2. Start the collector**
```bash
otelcol-contrib --config ~/opentelemetry/collector-kafka-config.yaml
```
The collector will start scraping Kafka metrics and sending them to New Relic within a few minutes.
````
#### (Optional) Instrument producer or consumer applications [#instrument-apps-prometheus]
> #### ⚠️ IMPORTANT
>
> **Language support**: Currently, only Java applications are supported for Kafka client instrumentation using the OpenTelemetry Java agent.
To collect application-level telemetry from your Kafka producer and consumer applications, download the OpenTelemetry Java agent if you haven't already:
```bash
mkdir -p ~/opentelemetry
curl -L -o ~/opentelemetry/opentelemetry-javaagent.jar \
https://github.com/open-telemetry/opentelemetry-java-instrumentation/releases/latest/download/opentelemetry-javaagent.jar
```
Start your application with the agent:
```bash
OTEL_AGENT="$HOME/opentelemetry/opentelemetry-javaagent.jar"
java \
-javaagent:$OTEL_AGENT \
-Dotel.service.name="order-process-service" \
-Dotel.resource.attributes="kafka.cluster.name=my-kafka-cluster" \
-Dotel.exporter.otlp.endpoint=http://collector-host-ip:4317 \
-Dotel.exporter.otlp.protocol="grpc" \
-Dotel.metrics.exporter="otlp" \
-Dotel.traces.exporter="otlp" \
-Dotel.logs.exporter="otlp" \
-Dotel.instrumentation.kafka.experimental-span-attributes="true" \
-Dotel.instrumentation.messaging.experimental.receive-telemetry.enabled="true" \
-Dotel.instrumentation.kafka.producer-propagation.enabled="true" \
-Dotel.instrumentation.kafka.enabled="true" \
-Dotel.instrumentation.runtime-telemetry.enabled="false" \
-jar your-kafka-application.jar
```
##### Configuration parameters
The following table describes the key configuration parameters:
| Parameter | Description |
| -------------------- | ----------------------------------------------------------------------------------------------------------------------------- |
| `service.name` | Replace with a unique name for your producer or consumer application, for example `order-process-service` |
| `kafka.cluster.name` | Replace with the same cluster name used in your collector configuration, for example `my-kafka-cluster` |
| `otlp.endpoint` | Replace with the hostname or IP of the host running your OpenTelemetry Collector, for example `http://collector-host-ip:4317` |
> #### 💡 TIP
>
> The configuration above sends telemetry to an OpenTelemetry Collector running on `collector-host-ip:4317`. If you want a separate collector dedicated to application telemetry, create one with the following configuration:
>
> **Sample collector configuration**
>
> ````yaml
> receivers:
> otlp:
> protocols:
> grpc:
> endpoint: "0.0.0.0:4317"
>
> exporters:
> otlp/newrelic:
> endpoint: https://otlp.nr-data.net:4317
> headers:
> api-key: "${NEW_RELIC_LICENSE_KEY}"
> compression: gzip
> timeout: 30s
>
> service:
> pipelines:
> traces:
> receivers: [otlp]
> exporters: [otlp/newrelic]
> metrics:
> receivers: [otlp]
> exporters: [otlp/newrelic]
> logs:
> receivers: [otlp]
> exporters: [otlp/newrelic]
> ```
>
> ````
The Java agent provides [out-of-the-box Kafka instrumentation](https://opentelemetry.io/docs/zero-code/java/spring-boot-starter/out-of-the-box-instrumentation/) with zero code changes, capturing request latencies, throughput metrics, error rates, and distributed traces. For advanced configuration, see the [Kafka instrumentation documentation](https://github.com/open-telemetry/opentelemetry-java-instrumentation/tree/main/instrumentation/kafka).
#### (Optional) Forward Kafka broker logs [#forward-logs]
To collect Kafka broker logs and send them to New Relic, configure the filelog receiver in your OpenTelemetry Collector.
**Configure log collection**
Update your collector configuration at `~/opentelemetry/collector-kafka-config.yaml` to add the filelog receiver.
**Step 1. Add to receivers section:**
````yaml
receivers:
# ... existing receivers (otlp, prometheus/kafka-jmx, kafkametrics/cluster) ...
# File log receiver for Kafka broker logs
filelog/kafka_broker_1:
include:
- /path/to/kafka/logs/server.log
start_at: end
multiline:
line_start_pattern: '^\['
resource:
broker.id: "1"
kafka.cluster.name: ${env:KAFKA_CLUSTER_NAME}
```
**Step 2. Add logs pipeline to service section:**
```yaml
service:
pipelines:
# ... existing pipelines ...
# Logs pipeline for Kafka broker logs
logs/broker:
receivers: [filelog/kafka_broker_1]
processors: [memory_limiter, batch/export]
exporters: [otlp/backend]
```
**Configuration parameters**
The following table describes the key configuration parameters:
| Parameter | Description |
|-----------|-------------|
| `filelog/kafka_broker_1.include` | Update `/path/to/kafka/logs/server.log` to your actual Kafka log file path |
| `filelog/kafka_broker_1.resource.broker.id` | The `broker.id` resource attribute correlates logs with specific broker metrics and entities |
| Multiple broker receivers | For multiple brokers, create separate `filelog` receivers (e.g., `filelog/kafka_broker_2`, `filelog/kafka_broker_3`) with their respective broker IDs |
| `filelog/kafka_broker_1.multiline.line_start_pattern` | The `multiline` pattern assumes logs start with `[` — adjust if your log format differs |
| Log volume | Consider log volume and collection costs before enabling log forwarding |
| Reference | For complete configuration options, see the [filelog receiver documentation](https://github.com/open-telemetry/opentelemetry-collector-contrib/tree/main/receiver/filelogreceiver) |
**Step 3. Restart the collector:**
```bash
# If running in foreground, stop with Ctrl+C and restart
nrdot-collector --config ~/opentelemetry/collector-kafka-config.yaml
# Or for OpenTelemetry Collector
otelcol-contrib --config ~/opentelemetry/collector-kafka-config.yaml
```
````
**Find your logs in New Relic**
Your Kafka broker logs will appear in two places:
- **Broker entities**: Navigate to the Kafka broker entity in New Relic to see logs correlated with that specific broker
- **Logs UI**: Query all Kafka logs using the [Logs UI](https://docs.newrelic.com/docs/logs/ui-data/use-logs-ui/) with filters like `kafka.cluster.name = 'my-cluster'`
You can also query your logs with NRQL:
```sql
FROM Log SELECT * WHERE kafka.cluster.name = 'my-kafka-cluster'
```
## Find your data [#find-data]
After a few minutes, your Kafka data should appear in New Relic. See [Find your data](https://docs.newrelic.com/docs/opentelemetry/integrations/kafka/find-and-query-data) for detailed instructions on exploring your Kafka data across different views in the New Relic UI.
The following table summarizes where each signal type is stored. Replace `my-kafka-cluster` with your `KAFKA_CLUSTER_NAME` value in all queries below:
| Signal | Event type | What's included |
| ------- | ---------- | --------------------------------------------------------------------------------------------------------------- |
| Metrics | `Metric` | Broker, topic, partition, consumer group, and JVM metrics |
| Logs | `Log` | Logs from producer and consumer applications (via OTel Java agent) and broker logs collected via the Java agent |
| Traces | `Span` | Producer and consumer spans, including per-message `publish` and `receive` operations across topics |
### Metrics
Broker, topic, partition, consumer group, and JVM metrics are stored in the `Metric` event type. Replace `my-kafka-cluster` with your `KAFKA_CLUSTER_NAME` value:
```sql
FROM Metric SELECT * WHERE kafka.cluster.name = 'my-kafka-cluster' SINCE 30 minutes ago
```
### Logs
Logs from producer and consumer applications instrumented with the OpenTelemetry Java agent, and broker logs when `-Dotel.logs.exporter=otlp` is set, are stored in the `Log` event type:
```sql
FROM Log SELECT * WHERE kafka.cluster.name = 'my-kafka-cluster' SINCE 30 minutes ago
```
### Traces
Producer and consumer spans, including per-message `publish` and `receive` operations across topics, are stored in the `Span` event type:
```sql
FROM Span SELECT * WHERE kafka.cluster.name = 'my-kafka-cluster' SINCE 30 minutes ago
```
## Example [#example]
A complete working example with Docker Compose setup, OTel Collector config, OTel Java agent configuration, and sample producer/consumer applications is available in the [New Relic OpenTelemetry Examples repository](https://github.com/newrelic/newrelic-opentelemetry-examples/tree/main/other-examples/collector/kafka/self-host-kafka).
## Troubleshooting [#troubleshooting]
**Initial system checks**
Run these commands first to verify your setup. Use the results to identify which specific troubleshooting section to follow.
**Check if collector is running**:
````bash
# Check if port 4317 is listening (best indicator collector is running)
ss -tlnp | grep 4317
# Search for collector process (using bracket trick to exclude grep itself)
ps aux | grep "[k]afka-config.yaml"
# Or search for common collector names
ps aux | grep -E "[n]rdot-collector|[o]telcol"
```
If no results appear, the collector is not running. Start it following the [Install and start the collector](#install-start-collector) step.
**Check if Java agent is attached to Kafka brokers**:
```bash
# Search for Kafka processes with Java agent attached
ps aux | grep "[o]pentelemetry-javaagent"
```
**Note**: This command shows the full Java process with classpath, which can be very long (3+ lines per broker). This is expected. Look for `-javaagent:/path/to/opentelemetry-javaagent.jar` in the output.
**Test port connectivity**:
```bash
# Test Kafka bootstrap port (9092)
timeout 5 bash -c "/dev/null && echo "Port 9092 open" || echo "Port 9092 closed"
# Test OTLP collector port (4317)
timeout 5 bash -c "/dev/null && echo "Port 4317 open" || echo "Port 4317 closed"
```
**Check collector logs**:
```bash
# View recent collector output
tail -n 50 ~/logs/collector.log
```
**Verify environment variables**:
```bash
echo $NEW_RELIC_LICENSE_KEY
echo $KAFKA_CLUSTER_NAME
echo $KAFKA_BOOTSTRAP_BROKER_ADDRESSES
```
````
**Enable debug logging**
**Enable collector debug logs**: Add detailed logging to troubleshoot configuration issues
Add to your collector configuration:
````yaml
service:
telemetry:
logs:
level: "debug" # Enable detailed collector internal logs
```
**Add debug exporter**: View metrics in collector logs before sending to New Relic. The processor and exporter names differ by monitoring method:
**Java agent method**:
```yaml
exporters:
debug:
verbosity: detailed
otlp/newrelic:
endpoint: https://otlp.nr-data.net:4317
headers:
api-key: ${env:NEW_RELIC_LICENSE_KEY}
compression: gzip
timeout: 30s
service:
pipelines:
metrics/broker:
receivers: [otlp, kafkametrics]
processors: [resourcedetection, resource, filter/exclude_cluster_metrics, filter/internal_topics, transform/remove_extra_attributes, transform/des_units, cumulativetodelta, metricstransform/kafka_topic_sum_aggregation, filter/remove_partition_level_replicas, batch/aggregation]
exporters: [debug, otlp/newrelic] # Add debug exporter
metrics/cluster:
receivers: [otlp]
processors: [resourcedetection, resource, filter/include_cluster_metrics, transform/remove_broker_id, transform/remove_extra_attributes, transform/des_units, cumulativetodelta, groupbyattrs/cluster, metricstransform/cluster_max, batch/aggregation]
exporters: [debug, otlp/newrelic] # Add debug exporter
```
**Prometheus JMX Exporter method**:
```yaml
exporters:
debug:
verbosity: detailed
otlp/backend:
endpoint: ${env:NEW_RELIC_OTLP_ENDPOINT}
headers:
api-key: ${env:NEW_RELIC_LICENSE_KEY}
service:
pipelines:
metrics/broker:
receivers: [prometheus/kafka-jmx]
processors: [resource/cluster-name, filter/scrape-overhead, transform/metric-naming, transform/remove_attributes, filter/exclude_cluster_metrics, memory_limiter, cumulativetodelta, batch/export]
exporters: [debug, otlp/backend] # Add debug exporter
metrics/cluster/prometheus:
receivers: [prometheus/kafka-jmx]
processors: [resource/cluster-name, filter/scrape-overhead, transform/metric-naming, transform/remove_attributes, filter/include_cluster_metrics, transform/remove_broker_id, memory_limiter, cumulativetodelta, groupbyattrs/cluster, metricstransform/cluster_max, batch/export]
exporters: [debug, otlp/backend] # Add debug exporter
metrics/cluster/kafkametrics:
receivers: [kafkametrics/cluster]
processors: [resource/cluster-name, filter/internal_topics, transform/remove_attributes, metricstransform/topic-aggregation, filter/exclude_partition_replicas_metric, memory_limiter, cumulativetodelta, batch/export]
exporters: [debug, otlp/backend] # Add debug exporter
```
Then restart the collector and check logs:
```bash
# Check collector output log
tail -f ~/logs/collector.log
# Look for metric output in the logs
```
**Important**: Remove the debug exporter in production to avoid log overflow.
````
**No data appearing in New Relic**
**First, run the [Initial system checks](#initial-checks)** to verify collector and Java agent are running.
**Check collector logs for errors**: Look for authentication or connection failures
````bash
# Look for errors in collector output
tail -n 100 ~/logs/collector.log | grep -i "error\|fail\|refuse"
# Check for OTLP receiver activity
tail -n 100 ~/logs/collector.log | grep -i "otlp\|metric"
```
````
**Missing JMX metrics from Kafka brokers**
**First, run the [Initial system checks](#initial-checks)** to verify the Java agent is attached to Kafka processes.
**Check broker logs for Java agent initialization**:
````bash
# Find Kafka log directory (common locations)
find ~ -name "server.log" -path "*/kafka/logs/*" 2>/dev/null
# Check the log file for OpenTelemetry messages
# Replace with your actual Kafka log path
tail -100 ~/kafka/logs/server.log 2>/dev/null | grep -i "otel\|jmx" || echo "Log file not found or no OTel messages"
# Check directory where you started Kafka for nohup.out
ls -lh nohup.out 2>/dev/null && tail -100 nohup.out | grep -i "otel\|jmx" || echo "No nohup.out file found"
```
**Verify Java agent configuration**: Ensure the startup command matches the [Configure Kafka broker](#configure-broker) step
```bash
# Check if broker was started with correct Java agent parameters
ps aux | grep "[o]pentelemetry-javaagent" | grep -o "Dotel\.[^ ]*"
```
This should show all `-Dotel.*` parameters. Verify:
- `-Dotel.jmx.enabled=true`
- `-Dotel.jmx.config=`
- `-Dotel.exporter.otlp.endpoint=http://localhost:4317`
**Check collector logs for incoming JMX metrics**:
```bash
# Look for metrics coming from brokers
tail -n 100 ~/logs/collector.log | grep -i "broker.id\|kafka\|jmx"
```
````
**OTLP connection errors**
**First, run the [Initial system checks](#initial-checks)** to verify port 4317 is listening and accessible.
**Check collector logs for specific OTLP errors**:
````bash
# Look for connection refusals or timeouts
tail -n 100 ~/logs/collector.log | grep -i "connection refused\|context deadline exceeded\|failed to connect"
```
**Verify OTLP receiver configuration**: Ensure collector listens on `0.0.0.0:4317` (not `127.0.0.1`)
```yaml
receivers:
otlp:
protocols:
grpc:
endpoint: "0.0.0.0:4317" # Accepts connections from any interface
```
**Test remote connectivity** (if collector and Kafka are on different hosts):
```bash
# From Kafka broker machine, test connection to collector
timeout 5 bash -c "/dev/null && echo "Can reach collector" || echo "Cannot reach collector"
```
````
**High memory usage**
**1. Monitor collector memory usage**:
````bash
# Check memory usage of the collector process
ps aux | grep -E "[n]rdot-collector|[o]telcol" | awk '{print $1, $2, $4, $11}'
# Watch memory usage over time (refresh every 2 seconds)
watch -n 2 'ps aux | grep -E "[n]rdot-collector|[o]telcol" | awk "{print \$1, \$2, \$4, \$11}"'
# Check overall system memory
free -h
```
**2. Reduce monitored topics**: Limit collection to essential topics only
```yaml
receivers:
kafkametrics:
brokers: ${env:KAFKA_BOOTSTRAP_BROKER_ADDRESSES}
collection_interval: 30s
scrapers:
- brokers
- topics # Consider removing if not needed
- consumers # Consider removing if not needed
topic_match: "^(important-topic-1|important-topic-2)$" # Filter specific topics
```
**3. Reduce collection frequency**: Increase intervals to collect less often
For the collector's Kafka metrics receiver:
```yaml
receivers:
kafkametrics:
collection_interval: 60s # Increase from 30s to 60s
```
For JMX metrics from the Java agent, update the broker startup command:
```bash
-Dotel.metric.export.interval=60000 # Increase from 30000ms to 60000ms
```
**4. Optimize batch processing**: Reduce in-memory batch size
Java agent method — update `batch/aggregation`:
```yaml
processors:
batch/aggregation:
send_batch_size: 512 # Reduce from 1024
timeout: 60s
```
Prometheus JMX Exporter method — update `batch/export`:
```yaml
processors:
batch/export:
send_batch_size: 512 # Reduce from 1024
timeout: 30s
```
**5. Add a memory limiter**: Prevent the collector from exceeding a memory threshold
Java agent method:
```yaml
processors:
memory_limiter:
check_interval: 1s
limit_mib: 512 # Hard limit in MiB — drop data if exceeded
spike_limit_mib: 128 # Allowed spike above limit before dropping
batch/aggregation:
send_batch_size: 512
timeout: 60s
service:
pipelines:
metrics/broker:
receivers: [otlp, kafkametrics]
processors: [memory_limiter, resourcedetection, resource, filter/exclude_cluster_metrics, filter/internal_topics, transform/remove_extra_attributes, transform/des_units, cumulativetodelta, metricstransform/kafka_topic_sum_aggregation, filter/remove_partition_level_replicas, batch/aggregation]
exporters: [otlp/newrelic]
metrics/cluster:
receivers: [otlp]
processors: [memory_limiter, resourcedetection, resource, filter/include_cluster_metrics, transform/remove_broker_id, transform/remove_extra_attributes, transform/des_units, cumulativetodelta, groupbyattrs/cluster, metricstransform/cluster_max, batch/aggregation]
exporters: [otlp/newrelic]
```
Prometheus JMX Exporter method:
```yaml
processors:
memory_limiter:
check_interval: 1s
limit_mib: 512
spike_limit_mib: 128
batch/export:
send_batch_size: 512
timeout: 30s
service:
pipelines:
metrics/broker:
receivers: [prometheus/kafka-jmx]
processors: [memory_limiter, resource/cluster-name, filter/scrape-overhead, transform/metric-naming, transform/remove_attributes, filter/exclude_cluster_metrics, cumulativetodelta, batch/export]
exporters: [otlp/backend]
metrics/cluster/prometheus:
receivers: [prometheus/kafka-jmx]
processors: [memory_limiter, resource/cluster-name, filter/scrape-overhead, transform/metric-naming, transform/remove_attributes, filter/include_cluster_metrics, transform/remove_broker_id, cumulativetodelta, groupbyattrs/cluster, metricstransform/cluster_max, batch/export]
exporters: [otlp/backend]
metrics/cluster/kafkametrics:
receivers: [kafkametrics/cluster]
processors: [memory_limiter, resource/cluster-name, filter/internal_topics, transform/remove_attributes, metricstransform/topic-aggregation, filter/exclude_partition_replicas_metric, cumulativetodelta, batch/export]
exporters: [otlp/backend]
```
**6. Restart the collector after changes**:
```bash
# Find the collector process ID and stop it
pkill -f "collector-kafka-config.yaml"
# Restart NRDOT Collector
nrdot-collector --config ~/opentelemetry/collector-kafka-config.yaml
# Or restart OpenTelemetry Collector
otelcol-contrib --config ~/opentelemetry/collector-kafka-config.yaml
```
````
**Reduce data ingest**
The configuration includes an **Additional metrics** section for comprehensive monitoring. Removing it does not affect core New Relic UI functionality - broker health, consumer lag, cluster overview, and JVM dashboards all continue to work.
**1. Remove the Additional metrics section from the JMX config**
In `~/opentelemetry/kafka-jmx-config.yaml`, delete everything below this comment (through the end of the file):
````yaml
# ── Additional metrics — remove this section to reduce data ingest ───────────
# Request latency: total count, 50th percentile, and average (99p kept above)
- beans:
...
```
**2. Disable consumer offset metrics in the kafkametrics receiver**
In `~/opentelemetry/collector-kafka-config.yaml`, add to the `kafkametrics` receiver `metrics` section:
```yaml
receivers:
kafkametrics:
# ...existing config...
metrics:
kafka.consumer_group.offset:
enabled: false
kafka.consumer_group.offset_sum:
enabled: false
```
Consumer lag metrics (`kafka.consumer_group.lag`, `kafka.consumer_group.lag_sum`) remain enabled. These are what the New Relic Kafka UI uses for consumer monitoring views.
````
## Next steps [#next-steps]
- [Explore Kafka metrics](https://docs.newrelic.com/docs/opentelemetry/integrations/kafka/metrics-reference) - View the complete metrics reference
- [Create custom dashboards](https://docs.newrelic.com/docs/query-your-data/explore-query-data/dashboards/introduction-dashboards) - Build visualizations for your Kafka data
- [Set up alerts](https://docs.newrelic.com/docs/opentelemetry/integrations/kafka/find-and-query-data#alerts) - Monitor critical metrics like consumer lag and under-replicated partitions