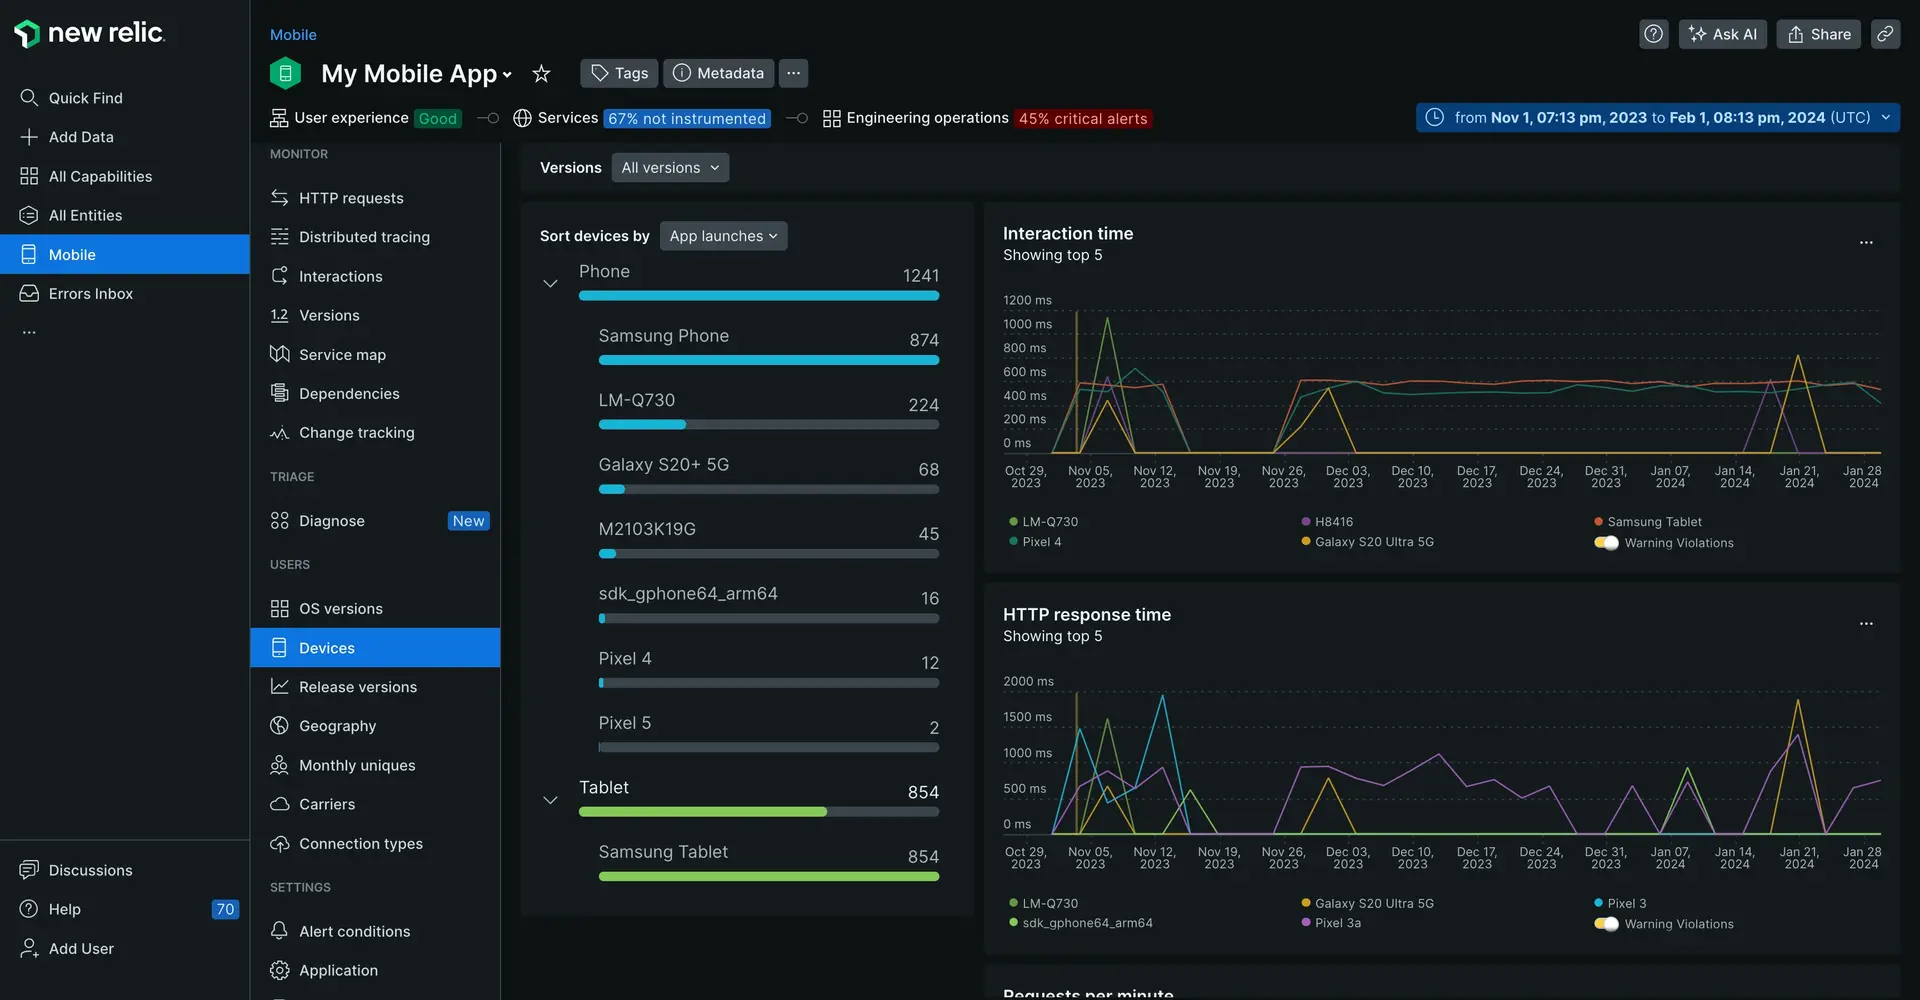
The Devices page for provides performance details about the top devices using your mobile application, such as iPad, iPhone, iPod Touch, Android Tablet, etc, and view metrics like:
- Interaction time
- HTTP request time
- Error rates and network failures
- Active user sessions

View the Devices page
- Go to one.newrelic.com > All capabilities > Mobile.
- Select your mobile app.
- In the left-hand menu, click Devices.
Drill down into specific metrics
To drill down into detailed information, use any of New Relic's standard user interface functions. In addition:
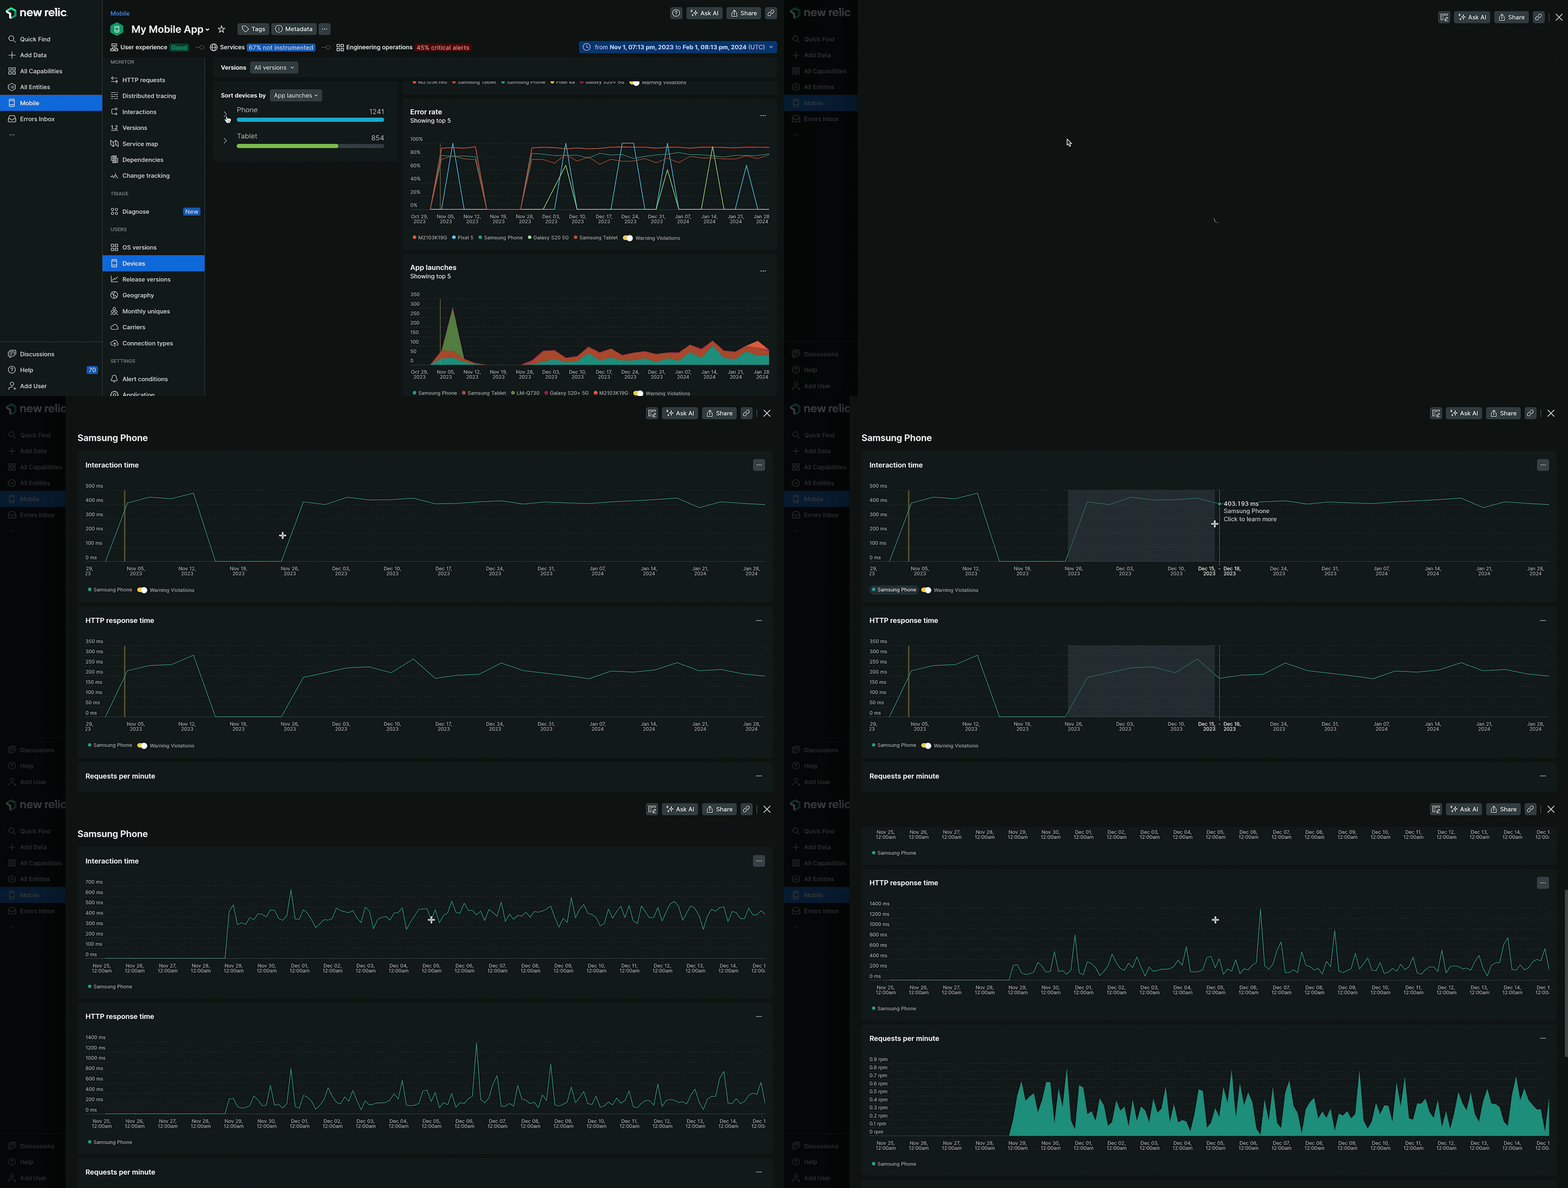
- To view a list of specific devices or models (for example, iPad mini, iPad Air, etc.), select the type (for example, iPad).
- To view details for a specific device or model, select its name from the expanded list.
- To view trace details a slow transaction (if available), select its link. For more information, see Interactions page.

Create alerts
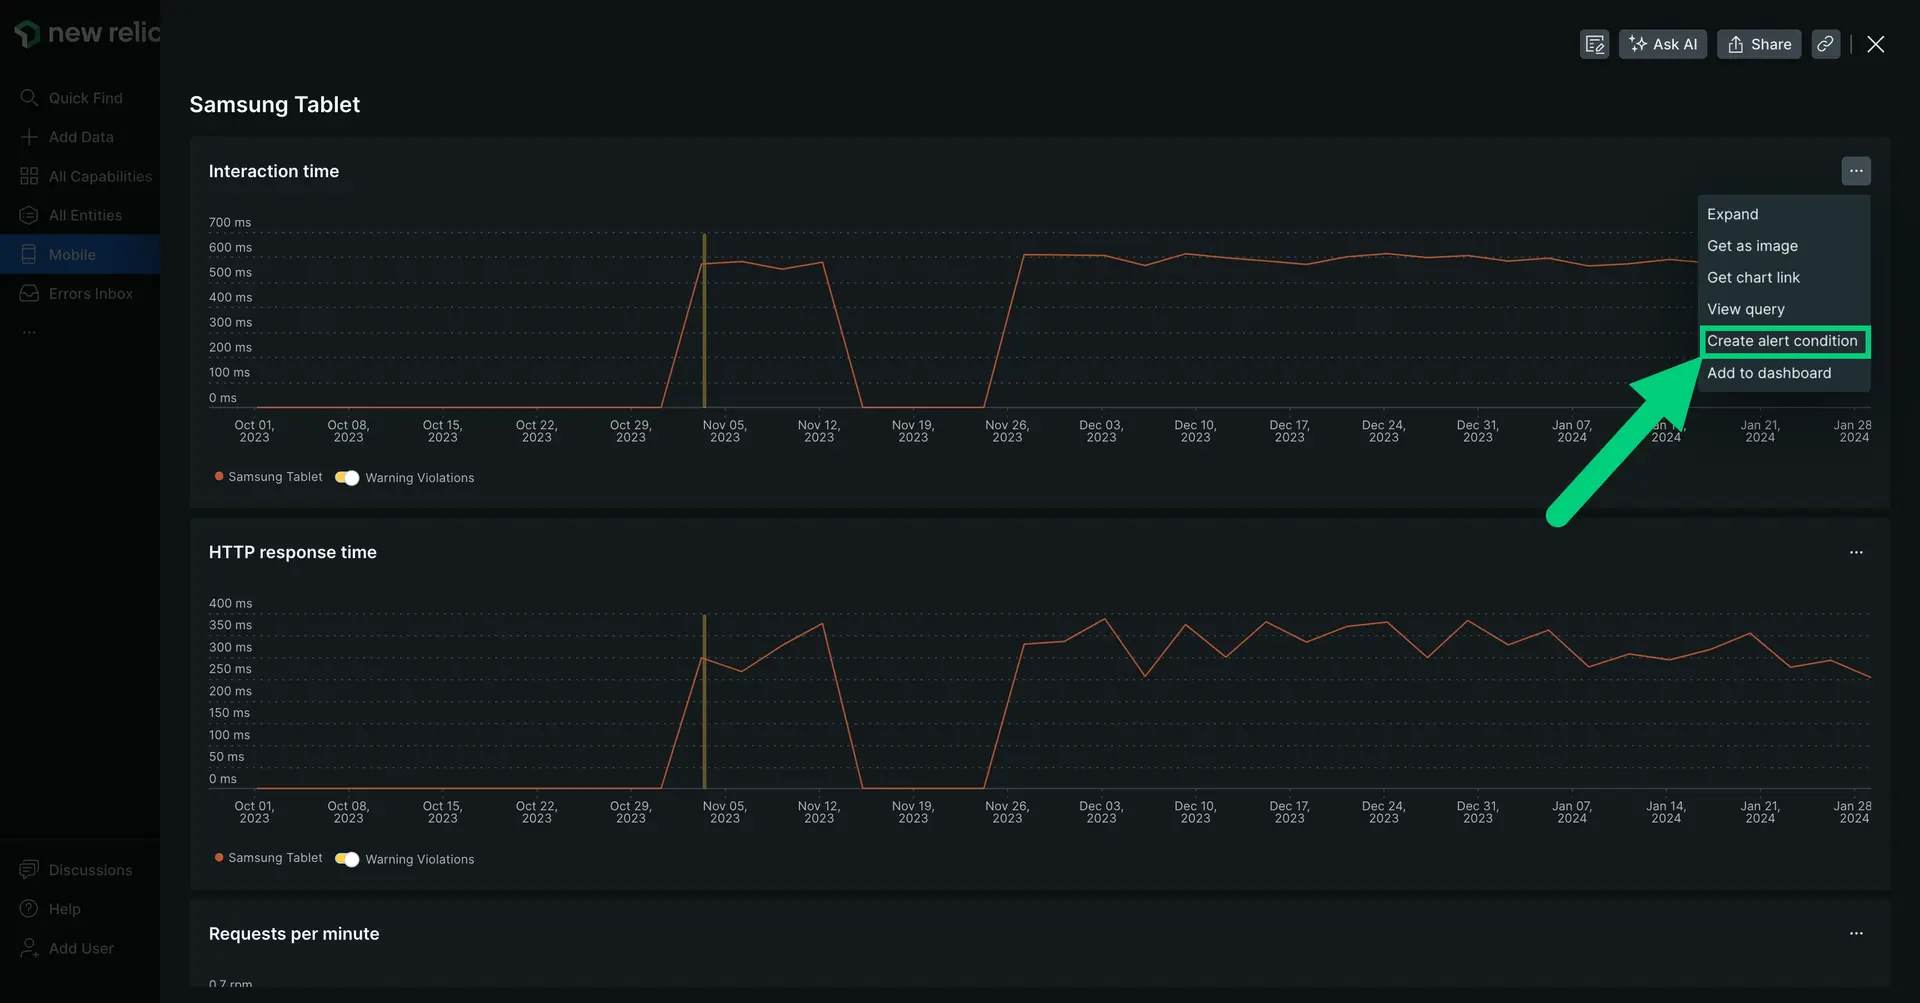
Now that you've got visibility into your app's performance, it's time to set up alerts for key performance changes.
Simply click on a metric, then from the chart menu, click Create alert condition and follow the steps in the UI.
