Distributed tracing data represents how the performance of entities across your distributed system impact each other. Insights from this data are surfaced with respect to individual entities you view, showing when their performance might be impacted by other traced entities.
The distributed trace insights view surfaces three types of performance signals from related traced entities.
- Call counts: Entities making a significantly increased number of calls through the service you are viewing. This increase impacts the throughput on your service.
- Exclusive time: Entities called down to by the service you are viewing, which are contributing significantly more latency. The latency (exclusive time) contributed by an entity is the wall-clock time that it had one or more processes running but was not making any external calls.
- Error rates: Entities called down to by the service you are viewing, which have more processes ending in errors.
The distributed tracing insights view is focused on helping you identify significant performance changes that might be impacting the service you are viewing. Traced entities are only listed if their impact on performance is relatively significant to the one you are viewing, and if that impact has increased with respect to the selected and previous time ranges. To maintain this focus, other entities that participate in traces with the one you are viewing are not shown here if their performance impact is relatively consistent or smaller.
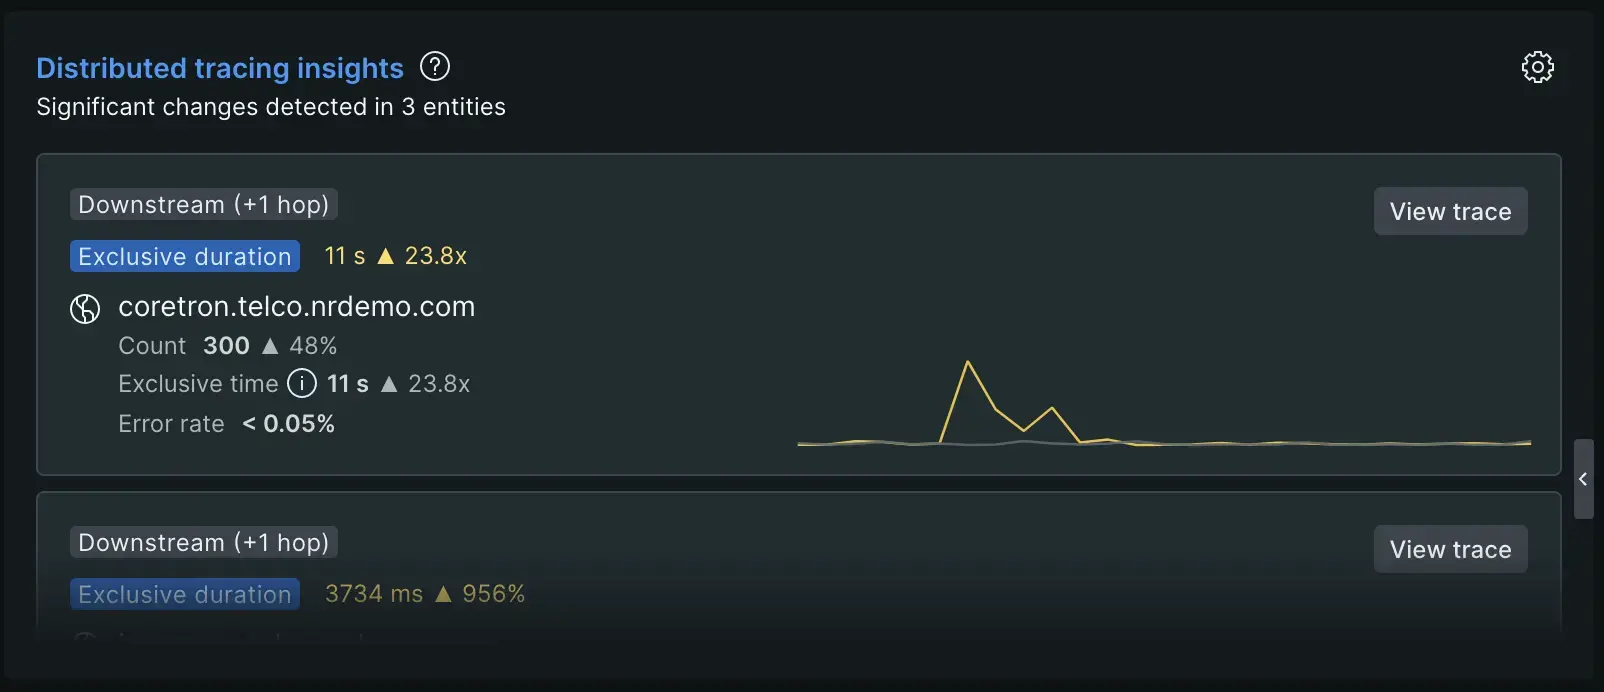
List of entities with a significant performance impact and change
- View impacted signals at a glance: When related trace entities undergo significant performance impact changes, you'll immediately see a list of the affected signals, along with their specific changes.
- Isolate key signals for quick action: If an entity is causing major performance impact shifts, each of those signals will be highlighted in its own dedicated card within the list, enabling you to quickly pinpoint and address potential issues.

Each item in the list shows:
- Call path direction:
UpstreamorDownstreamfollowed by the average number of hops in calls paths between that entity and your service.Upstream: Entities sending calls to your service, directly or indirectly.Downstream: Entities your service calls, directly or indirectly.
- The performance of the signal with a significant change in impact on your service, in aggregate and over time.
- The name of the the entity.
- The performance of the entity:
- Count: The number of traced calls to or from the listed entity, when it's in a call path with your entity.
- Error rate: The percent of calls to the listed entity that returned errors when called.
- Exclusive time: The average exclusive duration of calls that include your entity and the listed entity in the call path.
- View Trace button: Click this button to view trace details UI for a distributed trace where this performance impact between the other entity and your service was recorded.
Compare with options
By default, performance for the selected time in the time picker is compared to immediately preceding time, over the same duration. For example, when viewing the last 30 minutes in the time picker, performance is compared to the 30 minutes just before that time. This also allows you to select a spike in one of the other charts on the page, and see if this correlates with a significant performance impact from a related trace entity.
You may override the default compare with behavior by changing the value of the Compare with dropdown at the top of the APM Summary page. Modifying this selection will update the end of the comparison time window (without changing duration) used to calculate percent change of signal values in the following ways:
- None: The comparison time window will end at the beginning of the time picker window.
- Yesterday: The comparison time window will end one day before the beginning of the time picker window.
- Last week: The comparison time window will end 7 days before the beginning of the time picker window.
If there is no tracing data preserved in the comparison window, the distributed trace insights subheader will not contain a "compared with" clause.
Additional UI actions
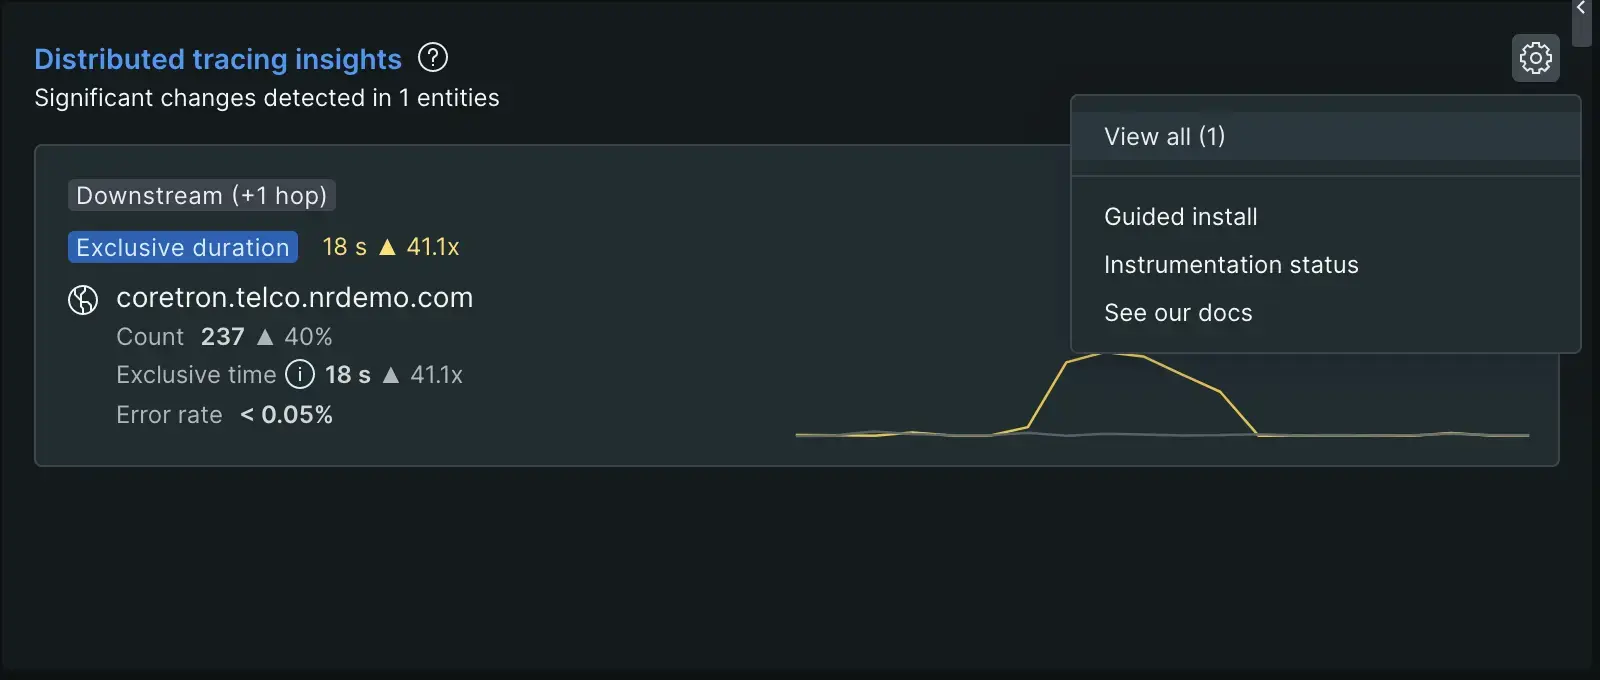
Click the gear icon at the top-right of the component for additional actions:
- View all to see a full-page view of this list when many signals are being displayed.
- Guided install walks you through the steps to enable distributed tracing for this service.
- Instrumentation status lists the distributed tracing configuration status for all of your services.
- See our docs is a link to this page.

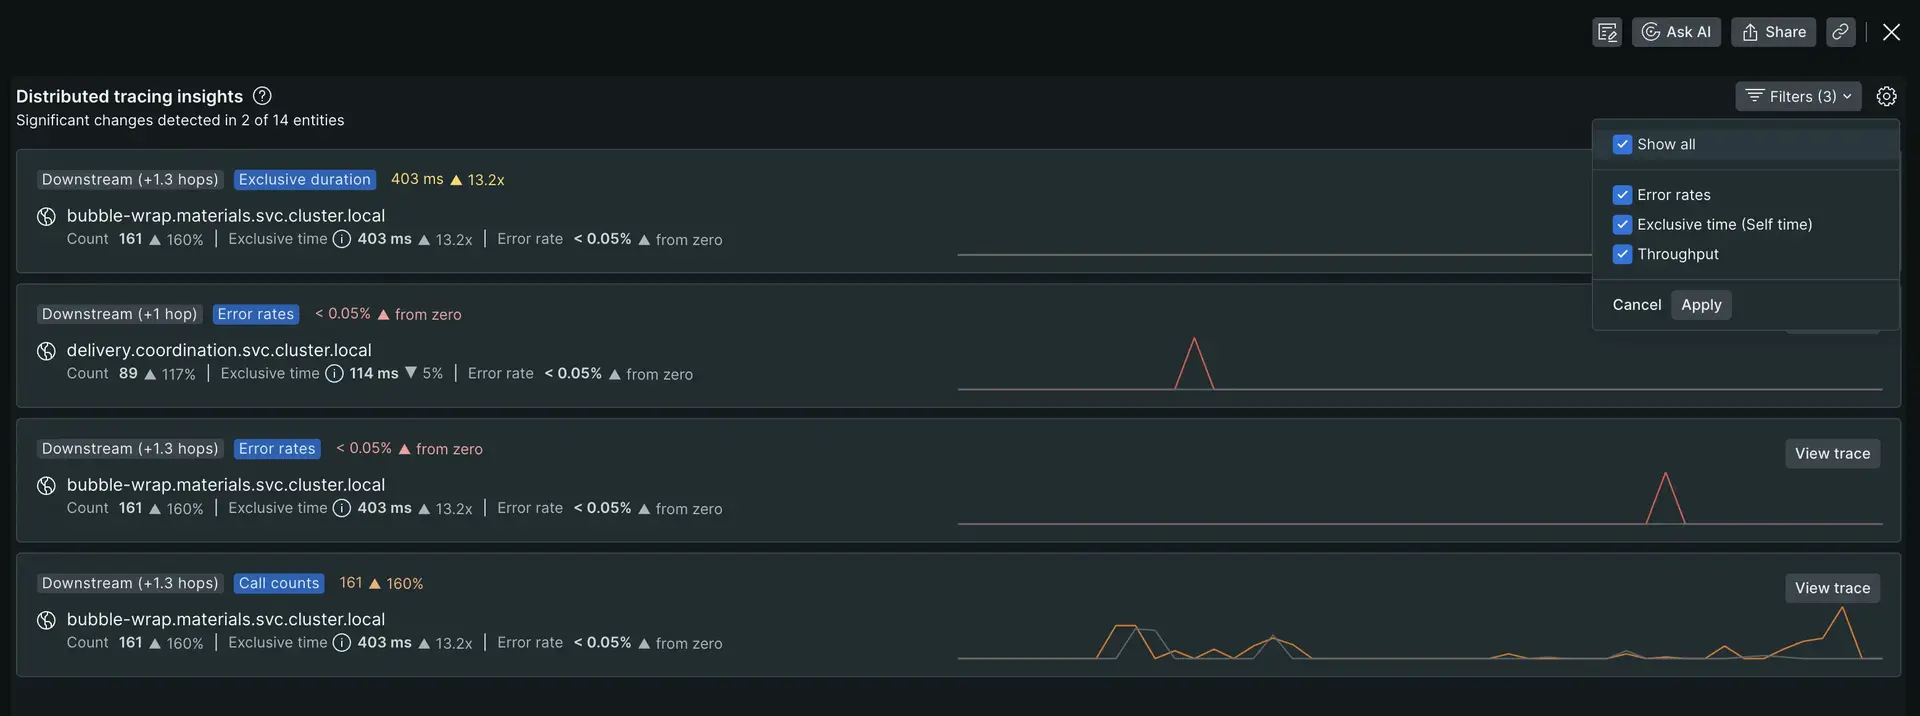
Full-page view
The full-page view shows the same list of significant signals but with more real estate to scroll through longer lists. It also includes a filter option to focus on signals of a particular type.

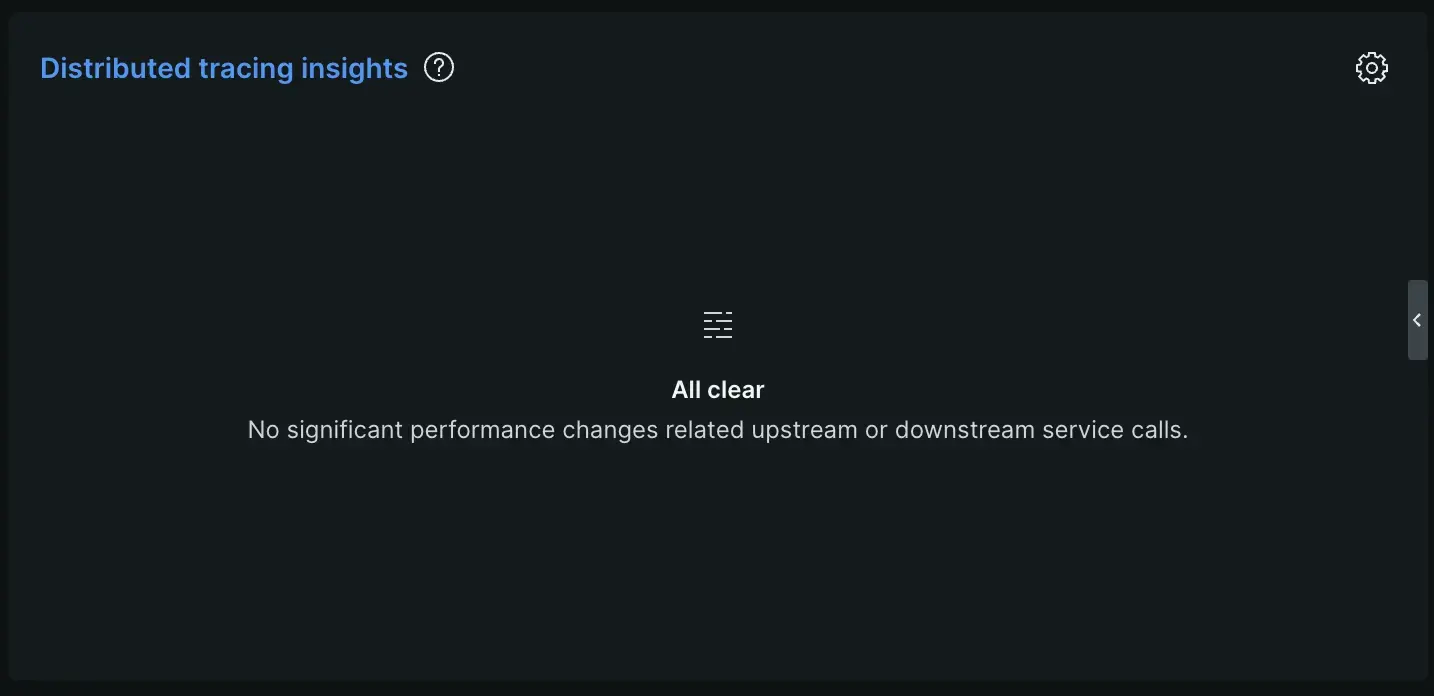
All-clear view
The all-clear view means no upstream or downstream services had a significant changes in their performance impact.

Understanding missing tracing data messages
To ensure you're working with the most relevant distributed tracing insights, here's a breakdown of the messages you might encounter when data is unavailable, along with recommended actions:
No data for this time range:- This message indicates that you've selected a time window for your service that falls outside the current retention period for trace data.
- To access insights, adjust the time range to focus on a period within the last week.
No data from your entity:- This message suggests that your service isn't currently reporting distributed tracing data.
- To unlock these valuable insights, set up distributed tracing for your service by following the guided install. If you're new to distributed tracing, start by reading the Distributed tracing: Planning guide.
No data from related entities;- This message indicates your service is reporting data but its dependencies aren't.
- By enabling distributed tracing for your services, your dependencies should also be automatically enabled.